# Quickstart
sqldash keeps your dashboards, metrics, and data agents as YAML files in the repos
that own them. These steps take you from nothing to a running dashboard, then to your
own data and your own agent, in a few minutes.
### Run the demo
```bash
uvx sqldash init --demo
uvx sqldash serve
```
`init --demo` creates a `.sqldash/` folder with a sample dashboard, a `metrics.yaml`, an
`agents.yaml`, and a generated orders CSV. `serve` opens the dashboard in your browser.
> [!TIP]
> The demo runs on DuckDB over the local CSV, so there is no warehouse to connect, no
> credentials, and nothing to set up.
### Change something
Open `.sqldash/demo.yaml` in your editor, change a tile's `chart: bar` to `chart: pie`,
and save. The dashboard updates in place.
You can make the same kind of change from the browser. Click **Edit** to drag, resize,
or delete tiles, or **+ Explore** to write a query, chart it, and add it as a new tile,
and sqldash writes each change back to the file. For changes you would rather describe
than click, open [AI Studio](/docs/studio/) and ask your coding agent.
### Connect your warehouse
Install sqldash with the driver for your warehouse, then run setup inside the project.
```bash
uv tool install 'sqldash[snowflake]'
sqldash setup
```
`setup` asks for the connection details, keeps your credentials out of the repo, and
tests the connection. [Setup](/docs/setup/) covers every flag, and
[Sources](/docs/sources/) covers every warehouse.
### Give your agent the metrics
Add sqldash as an MCP server in your coding agent, from inside the project.
Now your agent can answer questions from the same governed metrics your dashboards use.
> [!NOTE]
> These commands use the sqldash you installed with your warehouse driver, so the MCP
> server has the driver too. `"$PWD"` saves the project's absolute path, which matters
> because Codex keeps the setting for every project. If you are still on the demo and
> never installed sqldash, use `uvx sqldash mcp "$PWD"` instead.
---
# Install
You can try sqldash before installing it. `uvx` runs it from uv's cache and fetches
Python 3.11 or newer for it if your machine doesn't have one.
```bash
uvx sqldash init --demo
uvx sqldash serve
```
### Install the CLI
```bash
uv tool install sqldash # recommended
uv tool install 'sqldash[snowflake]' # with the driver for your warehouse
uv tool install 'sqldash[snowflake,postgres]' # or several
pip install 'sqldash[snowflake]' # pip needs Python 3.11 or newer
```
The base install includes DuckDB, SQLite, the MCP server, and AI Studio, which is
enough for the demo and for any dashboard over local files. Extras work with `uvx` too,
as in `uvx --from 'sqldash[snowflake]' sqldash serve`.
### Pick your warehouse driver
Each warehouse driver is an optional extra, so you only install what you use.
| extra | enables |
| --- | --- |
| `postgres` | Postgres |
| `snowflake` | Snowflake with SSO, password, PAT, or key pair auth |
| `bigquery` | BigQuery |
| `redshift` | Redshift |
| `databricks` | Databricks |
| `athena` | Athena |
| `mysql` | MySQL and MariaDB |
| `trino` | Trino |
| `clickhouse` | ClickHouse |
| `lookml` | `sqldash import lookml` |
| `snapshot` | `sqldash snapshot` for static PNG renders, plus a one-time browser download described in [Snapshots](/docs/snapshots/) |
| `all` | everything above, which pulls every driver and is heavy for CI |
> [!NOTE]
> DuckDB and SQLite need no extra. SQL Server needs `pyodbc` and an ODBC driver on the
> machine. See [Sources](/docs/sources/) for how to configure each one. When a dashboard
> needs a driver you have not installed, `sqldash lint` names the extra to add.
### Check it works
```bash
sqldash --version
sqldash init --demo /tmp/sqldash-demo && sqldash serve /tmp/sqldash-demo
```
The demo dashboard should open at `http://127.0.0.1:8400`. When it does, run
[Setup](/docs/setup/) to connect your own warehouse.
---
# Setup
`sqldash setup` connects a project to your warehouse. Run it inside the repo that should
hold the dashboards. It writes the connection details into `.sqldash/metrics.yaml`, which
you commit, and your credentials into a profile at `~/.config/sqldash/profiles.yaml`,
which stays on your machine with `chmod 600`. Then it tests the connection.
### Run it in the project
```bash
cd ~/work/analytics
sqldash setup
```
In a terminal it is an interactive wizard that asks which warehouse you use and the
details it needs.
### Or pass every answer as a flag
Scripts, CI, and coding agents can skip the questions.
```bash
sqldash setup --type snowflake \
--account acme-prod --warehouse WH --database ANALYTICS \
--username analyst@acme.com --auth externalbrowser
```
`--type` takes `duckdb`, `postgres`, `snowflake`, `bigquery`, `databricks`, `mysql`,
or `url` (any SQLAlchemy URL). Snowflake `--auth` takes `externalbrowser`,
`password`, `pat`, or `keypair`. `--password-env` and `--token-env` name the
environment variable a secret is read from, `--profile` names the profile,
`--skip-test` skips the connection probe, and `--register` also adds the project to
the repos you [serve together](/docs/workspaces/).
### Check the connection
```bash
sqldash source test
```
It connects to each source and reports how long it took.
## Keeping credentials out of the repo
Tracked YAML never holds a secret, and two mechanisms keep it that way.
- **Environment references.** Any source field can say `${env:SNOWFLAKE_PASSWORD}`,
and the value is read from the environment at connect time.
- **Profiles.** A source can say `profile: acme-prod`, and the matching entry in
`~/.config/sqldash/profiles.yaml` is merged in. Like AWS named profiles, the repo
names the profile and each teammate defines it locally with their own credentials.
```yaml
# in the dashboard
source:
type: snowflake
account: acme-prod
profile: acme-prod
```
```yaml
# in ~/.config/sqldash/profiles.yaml, per teammate, not committed
acme-prod:
username: analyst@acme.com
authentication: externalbrowser
```
Secrets resolve in memory at connect time and are never written back. Everything that
leaves the process, including `source list`, the served UI, MCP, `export context`, and
error messages, prints passwords, tokens, and connection options as `•••`. And
`sqldash lint` warns about a plaintext secret in a tracked file, which
`sqldash lint --strict` in CI turns into a failed pull request.
---
# MCP
`sqldash mcp` runs a Model Context Protocol server that gives AI agents your governed
metrics, dashboards, and data agents. Agents ask for metrics by name and sqldash writes
the SQL, so an agent never needs raw warehouse access and never invents its own
definition of revenue.
The server speaks MCP over stdio. Your MCP client starts it as a local command, and it
queries the warehouse with the credentials on your machine.
## Set it up
Pick your client, choose how you run sqldash, add your warehouse extra if you use one,
and enter the project path. Copy what appears into the place it says.
Run with
Terminal
Both ways of running sqldash work. `uvx sqldash mcp` downloads and runs the latest
release on demand, so there is nothing to install or upgrade. If you installed sqldash
with `uv tool install sqldash` or `pip`, the command is just `sqldash mcp`, which starts
faster and uses exactly the version you installed.
The project can be a directory, a single dashboard file, or a git URL, and `--all`
serves every repo you have registered.
```bash
uvx sqldash mcp /path/to/project
uvx sqldash mcp git@github.com:acme/analytics.git
uvx sqldash mcp --all
```
> [!WARNING]
> The MCP server needs your warehouse driver too. `uvx sqldash` runs the base package, so
> if you installed an extra such as `sqldash[snowflake]`, either point the client at your
> installed `sqldash` or tell `uvx` which extra to include.
```bash title="Terminal"
codex mcp add sqldash -- uvx --from 'sqldash[snowflake]' sqldash mcp /path/to/project
codex mcp add sqldash -- sqldash mcp /path/to/project
```
Some desktop apps do not inherit your shell's `PATH`. If a client says it cannot find
`uvx` or `sqldash`, run `which uvx` or `which sqldash` and use that absolute path as the
command.
The sections below show each client's setup in full.
## Codex
```bash
codex mcp add sqldash -- uvx sqldash mcp /path/to/project
```
This writes an entry to `~/.codex/config.toml`, which the Codex CLI and the Codex IDE
extension both read, so one setup covers both. Run `codex mcp list` to check it, or type
`/mcp` inside a Codex session. You can also add it by hand.
```toml
[mcp_servers.sqldash]
command = "uvx"
args = ["sqldash", "mcp", "/path/to/project"]
```
To check agent answers with Codex, see graded runs in
[Agents and evaluations](/docs/agents/).
## Claude Code
Add the server from inside the project.
```bash
claude mcp add sqldash -- uvx sqldash mcp .
```
`--scope project` writes it to a `.mcp.json` file you can commit, so everyone who opens
the repo in Claude Code gets the same server. `--scope user` makes it available in all
your projects. Check it with `claude mcp list`.
## Cursor
Create `.cursor/mcp.json` in the project to share it with the repo, or
`~/.cursor/mcp.json` to use it everywhere.
```json
{
"mcpServers": {
"sqldash": {
"command": "uvx",
"args": ["sqldash", "mcp", "/path/to/project"]
}
}
}
```
## Claude Desktop
Open **Settings**, then **Developer**, then **Edit Config**. That opens
`claude_desktop_config.json`, which lives in `~/Library/Application Support/Claude/` on
macOS and `%APPDATA%\Claude\` on Windows. Add the server and restart the app.
```json
{
"mcpServers": {
"sqldash": {
"command": "/Users/you/.local/bin/uvx",
"args": ["sqldash", "mcp", "/Users/you/work/analytics"]
}
}
}
```
Claude Desktop does not start in your project folder, so use absolute paths for both
the command and the project.
## GitHub Copilot in VS Code
GitHub Copilot's agent mode reads `.vscode/mcp.json` in the workspace.
```json
{
"servers": {
"sqldash": {
"type": "stdio",
"command": "uvx",
"args": ["sqldash", "mcp", "${workspaceFolder}"]
}
}
}
```
## Windsurf
Add the server to `~/.codeium/windsurf/mcp_config.json`.
```json
{
"mcpServers": {
"sqldash": {
"command": "uvx",
"args": ["sqldash", "mcp", "/path/to/project"]
}
}
}
```
## Gemini CLI
Add the server to `~/.gemini/settings.json`, or to `.gemini/settings.json` inside the
project.
```json
{
"mcpServers": {
"sqldash": {
"command": "uvx",
"args": ["sqldash", "mcp", "."]
}
}
}
```
## Any other client
Any client that can launch a local stdio server works. Give it `uvx` as the command and
`["sqldash", "mcp", ""]` as the arguments. Pass warehouse credentials the same
way you would in a terminal, either through a local profile or through environment
variables set in the client's server config. See [Setup](/docs/setup/).
## What agents can do
Once connected, ask in plain language. The agent picks the tools.
- "Which metrics do we have for orders?"
- "How did revenue by region do over the last 30 days compared to the month before?"
- "Add a tile to the revenue dashboard showing average order value by category."
Here is what a `query_metric` call looks like when an agent asks about revenue by
region. These are the arguments it sends.
```json
{
"name": "revenue",
"dimensions": ["region"],
"start": "-30d",
"end": "today",
"compare": "previous_period"
}
```
This is the response from the demo project, trimmed. It carries the SQL sqldash
compiled, the rows, and the comparison window.
```json
{
"sql": "SELECT region AS \"region\", SUM(amount) AS \"revenue\"\nFROM orders\nWHERE order_date >= ? AND order_date < ?\nGROUP BY 1\nORDER BY 1",
"columns": [{"name": "region", "type": "string"}, {"name": "revenue", "type": "float"}],
"rows": [["apac", 51669.37], ["eu", 82629.99], ["us", 106091.64]],
"row_count": 3,
"truncated": false,
"row_limit": 1000,
"compare": {
"mode": "previous_period",
"label": "previous period",
"window": {"start": "2026-07-27", "end": "2026-08-26"},
"rows": [["apac", 46771.12], ["eu", 77790.07], ["us", 106871.71]]
}
}
```
The values are bound as query parameters, the `?` marks in the SQL. The agent passed
names and values, never SQL.
## Tools
| tool | what it does |
| --- | --- |
| `list_metrics` | Every governed metric with its description, dimensions, time grain, and synonyms. |
| `get_metric` | The full definition of one metric. |
| `query_metric` | Evaluates a metric. Takes `name`, and optionally `dimensions`, `grain`, `filters`, `start`, `end`, `compare`, `dashboard`, and `limit`. |
| `list_sources` | The project's data sources, with credentials redacted. |
| `get_schema` | Tables and columns for a source, named by a key from `list_sources`. Structure only, never rows. |
| `get_dashboards` | The project's dashboards, with their tiles, metrics, and queries. |
| `validate_metrics` | Checks candidate `metrics.yaml` content without writing a file. |
| `validate_dashboard` | Checks a candidate dashboard with the same rules as `sqldash lint`. Pass `name` when you know what the file will be saved as, so an edit is told apart from a new file. |
| `run_sql` | Runs one statement, refusing writes by keyword, on an optional `source`. It only exists when the server starts with `--allow-sql`. |
`filters` takes dimension values, such as `{"region": "eu"}`, lists for several values,
or an operator such as `{"op": ">=", "value": 100}`. `start` and `end` take ISO dates or
tokens like `-30d`, `mtd`, and `ytd`. `compare` needs both `start` and `end`, or a
`dashboard` whose date filter has a default. `dashboard` also applies that dashboard's
filter defaults, and anything they narrowed that you did not ask for comes back in a
`scope_note` field.
The server caps every call at 1000 rows, and `--row-limit` changes that cap. `limit` is
the caller's own, smaller cap. Every result carries `row_limit`, the cap that applied,
and `truncated`, which says whether it clipped the answer, so a short series is never
mistaken for a complete one.
`run_sql` is a keyword check and a row cap, not a sandbox. The grants of the credential
sqldash connects with are the real guardrail, so give it a read-only role before you
turn `--allow-sql` on.
## Data agents and their tools
Each agent in `agents.yaml` is served as an MCP prompt, and each of its data tools as an
extra tool. In the demo project, the server lists a `finance_analyst` prompt next to the
built-in tools, plus `revenue_health` and `top_categories`. How a client presents
prompts depends on the client. Some offer them as slash commands or skills, and others
only use the tools. See [Agents and evaluations](/docs/agents/).
## Many repos in one server
Register the repos whose metrics matter, then serve them all at once.
```bash
sqldash repo add git@github.com:acme/payments.git
sqldash repo add git@github.com:acme/growth.git
```
With `--all`, metric names carry their repo, as in `payments/revenue` and
`growth/signups`. Agents are named `repo/agent`, and agent tools `repo__tool`, because
MCP tool names cannot contain a slash. See [Many repos](/docs/workspaces/).
## How agents change dashboards
There is no tool that saves a file. When an agent builds or edits a dashboard, it
writes the YAML itself in your repo, calls `validate_dashboard` to check it, and you
review the change in a pull request like any other code. `validate_dashboard` applies
the same rules as `sqldash lint`, so a file that passes for the agent also passes in
CI.
## Give agents the context up front
`sqldash export context` writes a markdown summary of the project's metrics, dashboards,
and agents. Codex reads `AGENTS.md` and Claude Code reads `CLAUDE.md`, so put the summary
where your agent looks.
```bash
sqldash export context --out sqldash-context.md
```
If the repo already has an `AGENTS.md` or `CLAUDE.md`, paste the summary into it rather
than replacing it, so existing instructions survive. Start a new agent session afterwards
so the agent picks it up, and export again when the metrics change.
---
# Dashboards
A dashboard is one YAML file that holds the connection, the filters, the queries, and
the tiles. Here is a trimmed version of the demo that `sqldash init --demo` writes.
```yaml
title: Order Analytics
description: Demo dashboard over a local CSV. Swap the source for your warehouse.
source: {type: duckdb, attach_files: true}
filters:
- {name: dates, type: daterange, label: Date range, default: last_60_days}
- name: region
type: select
label: Region
options_sql: "SELECT DISTINCT region FROM orders ORDER BY region"
tiles:
- title: Total revenue
metric: revenue
size: 6x2
compare: previous_period
- title: Revenue by category
chart: bar
format: currency
size: 6x4
sql: |
SELECT category, ROUND(SUM(amount), 2) AS revenue
FROM orders
WHERE order_date BETWEEN {{ dates_start }} AND {{ dates_end }}
{% if region %}AND region = {{ region }}{% endif %}
GROUP BY 1
ORDER BY 2 DESC
- size: 12x2
markdown: |
**This whole dashboard is one YAML file.**
```
Dashboard files live in `.sqldash/` at the root of a repo, which is what `init`
creates. You can also serve a single file directly with `sqldash serve report.yaml`.
Every dashboard file in `.sqldash/` shows up in the dashboard picker.
## The top of the file
| key | what it does |
| --- | --- |
| `title` | Required. The name shown in the picker and at the top of the page. |
| `description` | A line of context under the title. |
| `source` | The connection, or several named connections. See [Sources](/docs/sources/). |
| `filters` | Controls at the top of the page that feed values into queries. |
| `tiles` | Everything on the grid, in order. |
| `queries` | Named SQL that several tiles can share. |
| `metrics`, `relations` | Metrics defined inside this dashboard, so a single file stays portable. |
| `layout` | Grid settings, such as `row_height` in pixels. |
| `refresh` | Re-runs every tile on an interval, such as `30s`, `5m`, or `1h`. |
| `currency`, `locale` | Defaults for number formatting. |
| `css` | A theme for this dashboard. See [Themes](/docs/themes/). |
Unknown keys are errors with a did-you-mean hint, so a typo never fails silently.
## Tiles
A tile shows either data or text. A data tile gets its data from exactly one place, and
the three ways look like this.
```yaml
tiles:
# 1. a governed metric from metrics.yaml
- title: Revenue by month
metric: {name: revenue, grain: month, dimensions: [region]}
chart: {type: line, group_by: region}
# 2. inline SQL
- title: Largest orders
chart: table
sql: |
SELECT order_date, region, amount
FROM orders
ORDER BY amount DESC
LIMIT 20
# 3. a named query shared with other tiles
- title: Orders by region
query: orders_by_region
chart: bar
queries:
orders_by_region: |
SELECT region, COUNT(*) AS orders FROM orders GROUP BY 1
```
Use a metric whenever one exists. The tile then inherits the metric's definition and
format, respects its allowed dimensions, and stays in step with the CLI and agents. Use
inline SQL for one-off views, and a named query when several tiles need the same result.
A text tile is just a `markdown:` key, useful for headings, notes, and links.
```yaml
- size: 12x1
markdown: |
### Revenue
Figures are in USD and exclude refunds. [Metric definitions](https://example.com)
```
### Every tile key
| key | what it does |
| --- | --- |
| `title` | The tile's heading. Also used to derive its id. |
| `id` | A stable name for the tile. Set it when a theme rule or an agent refers to the tile. |
| `metric`, `sql`, `query` | Where the data comes from. Exactly one. |
| `grain` | The time grain for a metric tile, such as `day` or `month`. |
| `compare` | `previous_period` or `yoy` on a metric tile. See below. |
| `chart` | How to draw the result. See below. |
| `format` | How to format numbers. See below. |
| `source` | Which named connection to run against, when the dashboard has several. |
| `size`, `position` | Where the tile sits on the grid. See below. |
| `markdown` | Text for a text tile. |
## Charts
A data tile draws its result with `chart:`. There are seven chart types. A tile without
`chart:` shows its result as a table.
### How sqldash picks the columns
You rarely need to say which column goes on which axis. For line, area, bar, and scatter
charts, sqldash reads the result's columns and fills in what you leave out.
- The x axis is the first date or time column. If there is none, it is the first text
column, and failing that the first column.
- The values are every number column except the x axis and the `group_by` column.
- A pie takes its slice labels from the first text column and its sizes from the first
number column.
- A big number shows the first number column.
If you name a column the result does not have, sqldash ignores that setting and falls
back to these rules instead of drawing an empty chart.
### Line
Use a line for a value over time. One number column gives one line. Add `group_by` to
draw a line for each value of another column.
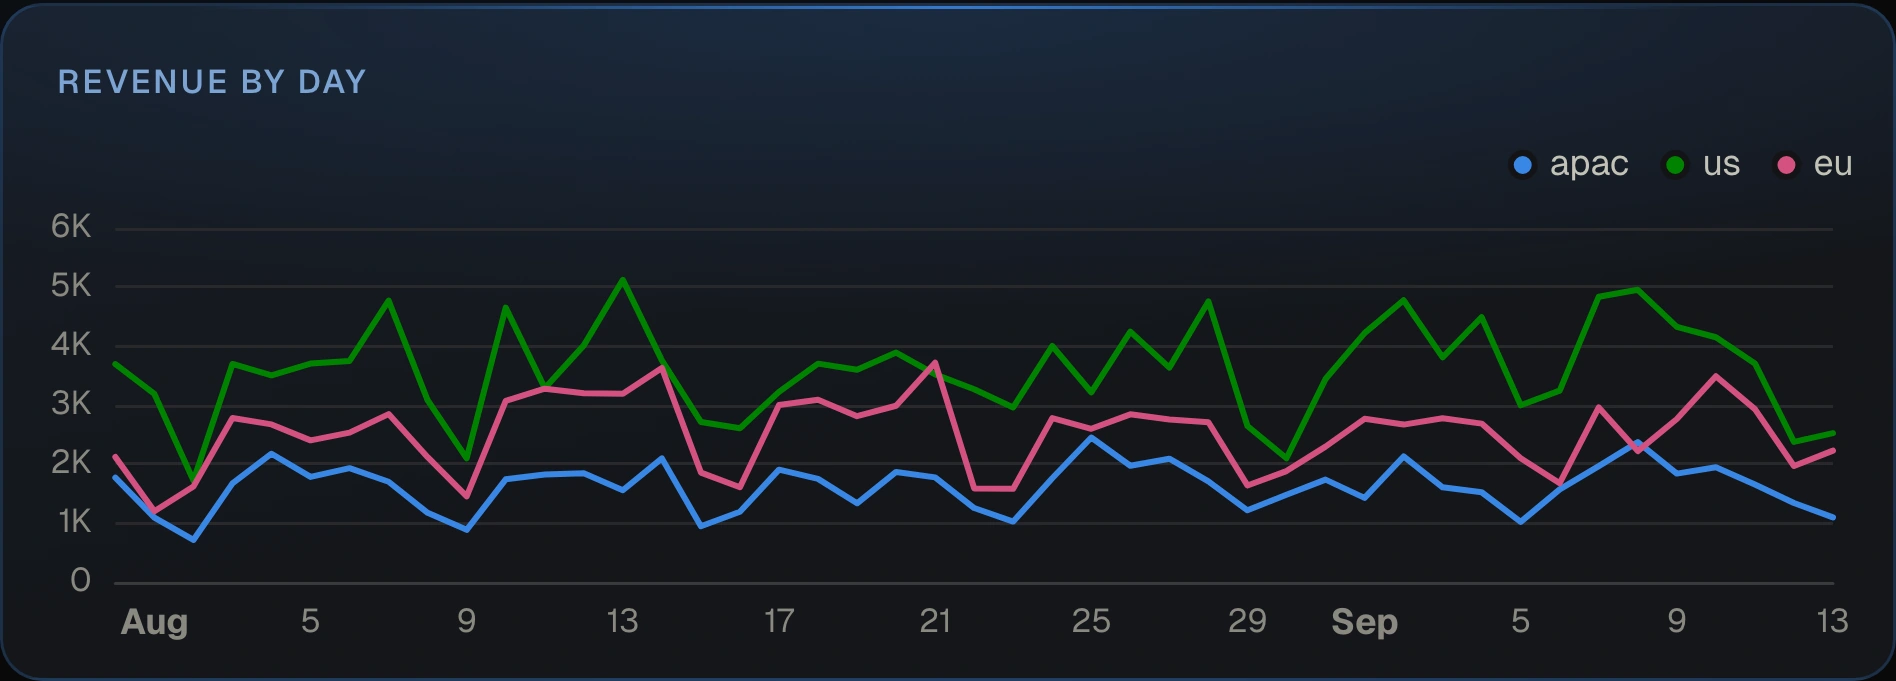
```yaml
- title: Revenue by day
chart: {type: line, group_by: region}
sql: |
SELECT order_date, region, ROUND(SUM(amount), 2) AS revenue
FROM orders GROUP BY 1, 2 ORDER BY 1
```
With `group_by`, the query returns one row per date and group, and sqldash turns each
group into its own series. The legend appears whenever there are two or more series.
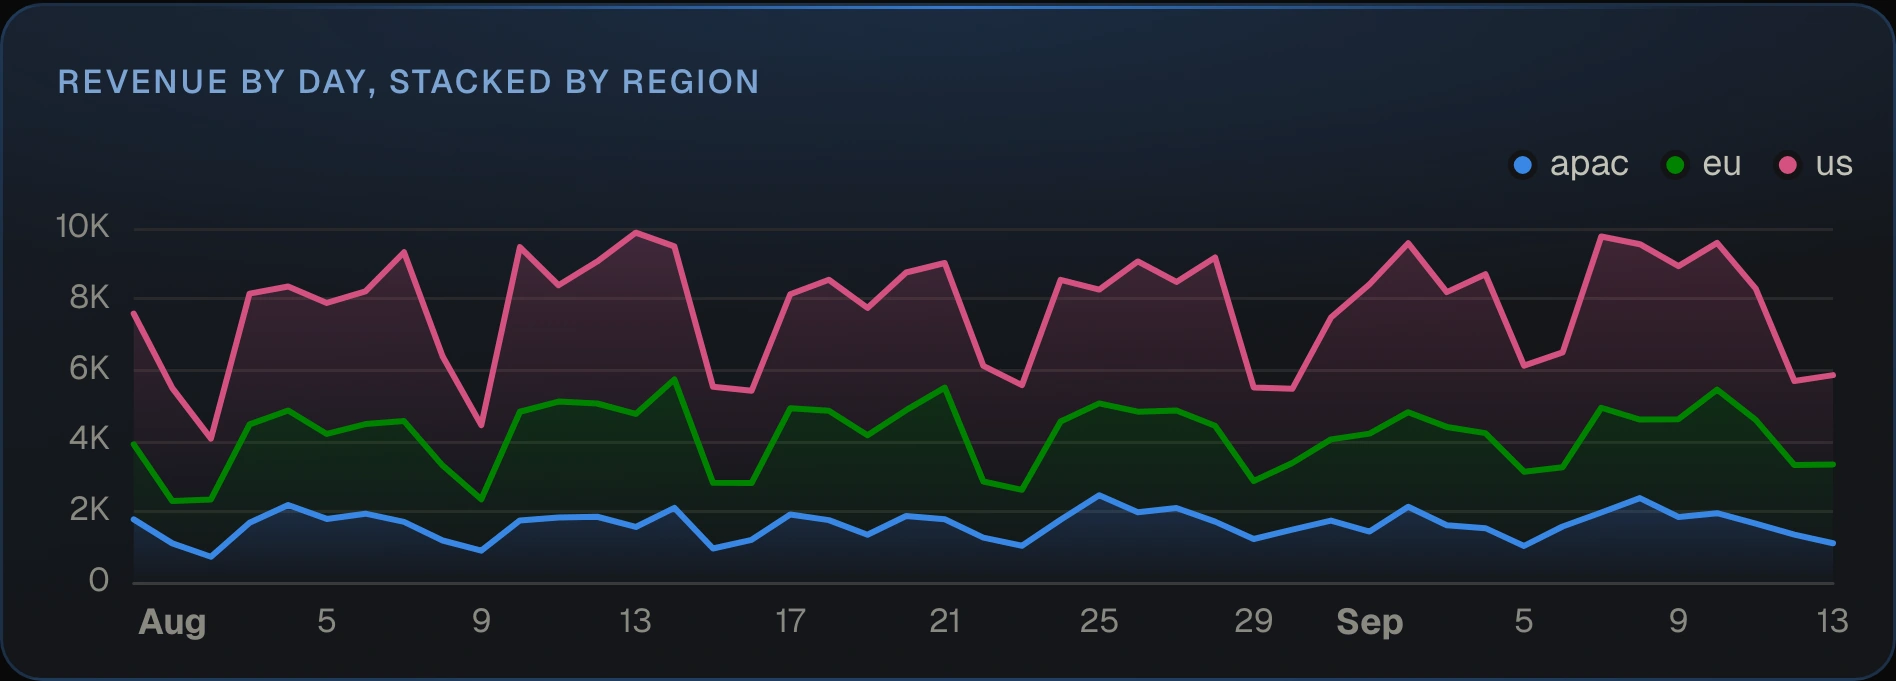
### Area
An area chart is a line chart with the space underneath filled in. Area series always
stack, so the top edge shows the total and each band shows its share of it.
```yaml
- title: Revenue by day, stacked by region
chart: {type: area, group_by: region}
sql: |
SELECT order_date, region, ROUND(SUM(amount), 2) AS revenue
FROM orders GROUP BY 1, 2 ORDER BY 1
```
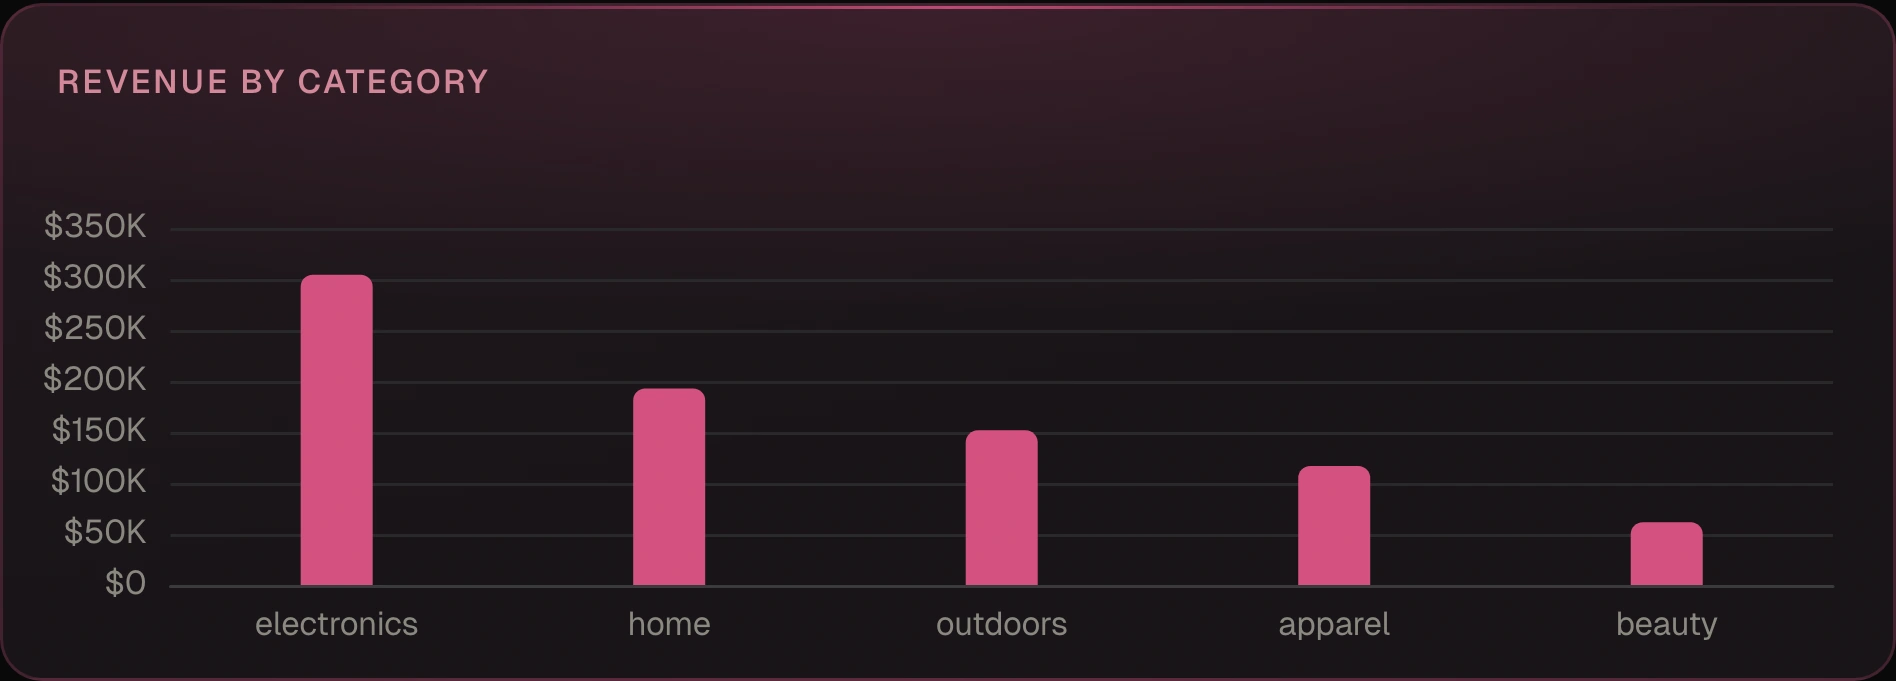
### Bar
Use bars to compare categories. The order of the bars follows the order of the rows, so
sort in SQL.
```yaml
- title: Revenue by category
chart: bar
format: currency
sql: SELECT category, ROUND(SUM(amount), 2) AS revenue FROM orders GROUP BY 1 ORDER BY 2 DESC
```
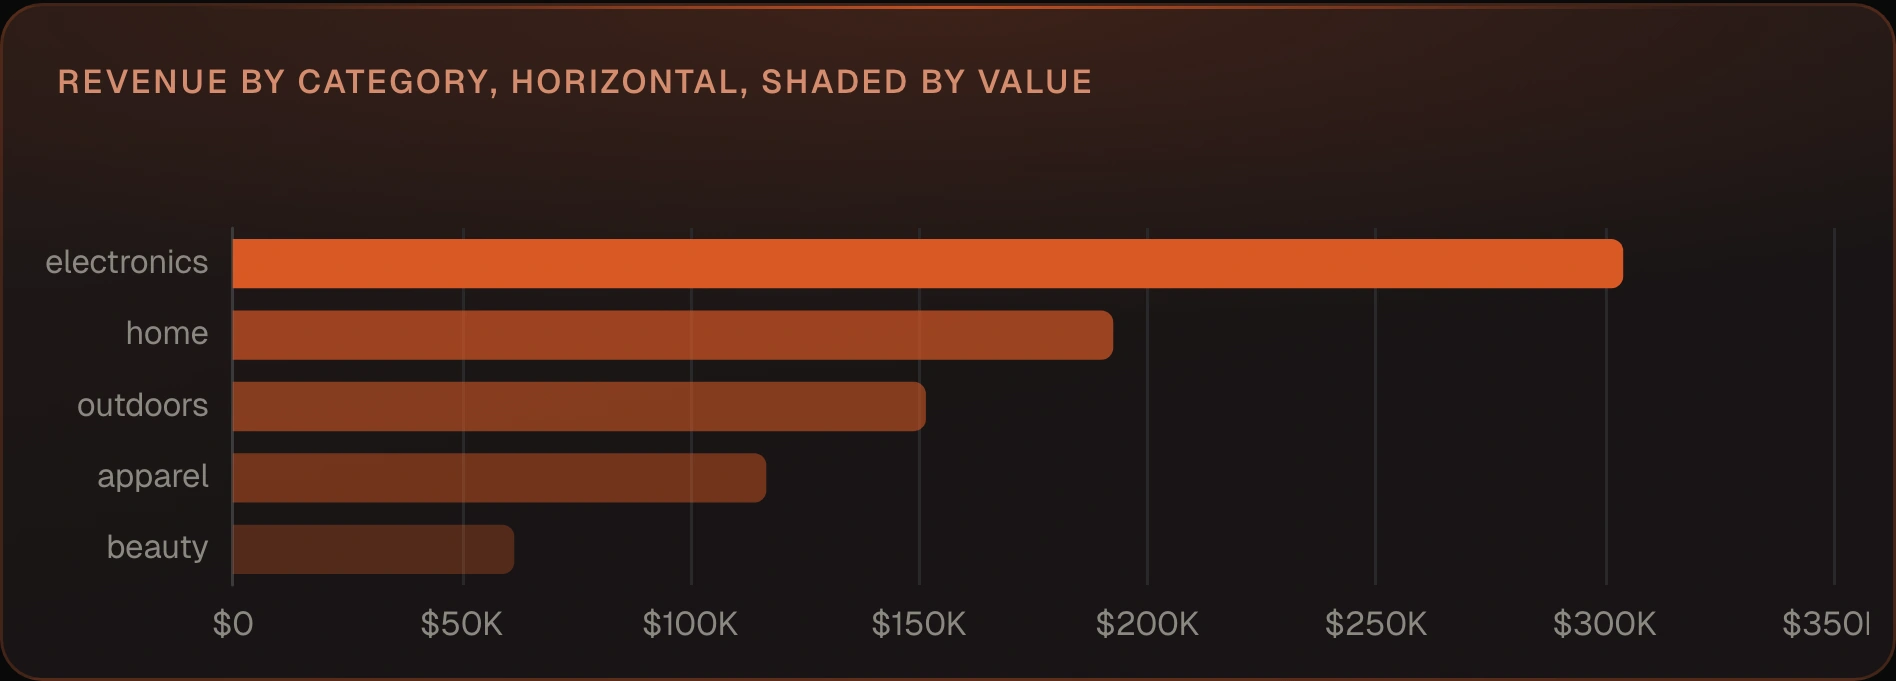
`orientation: horizontal` turns the bars sideways, which helps with long labels.
`color_by: value` shades a single series from light to dark by size.
```yaml
- title: Revenue by category
chart: {type: bar, orientation: horizontal, color_by: value}
format: currency
sql: SELECT category, ROUND(SUM(amount), 2) AS revenue FROM orders GROUP BY 1 ORDER BY 2
```
`group_by` splits each bar into a series per group. Bars sit side by side unless you
add `stacked: true`.
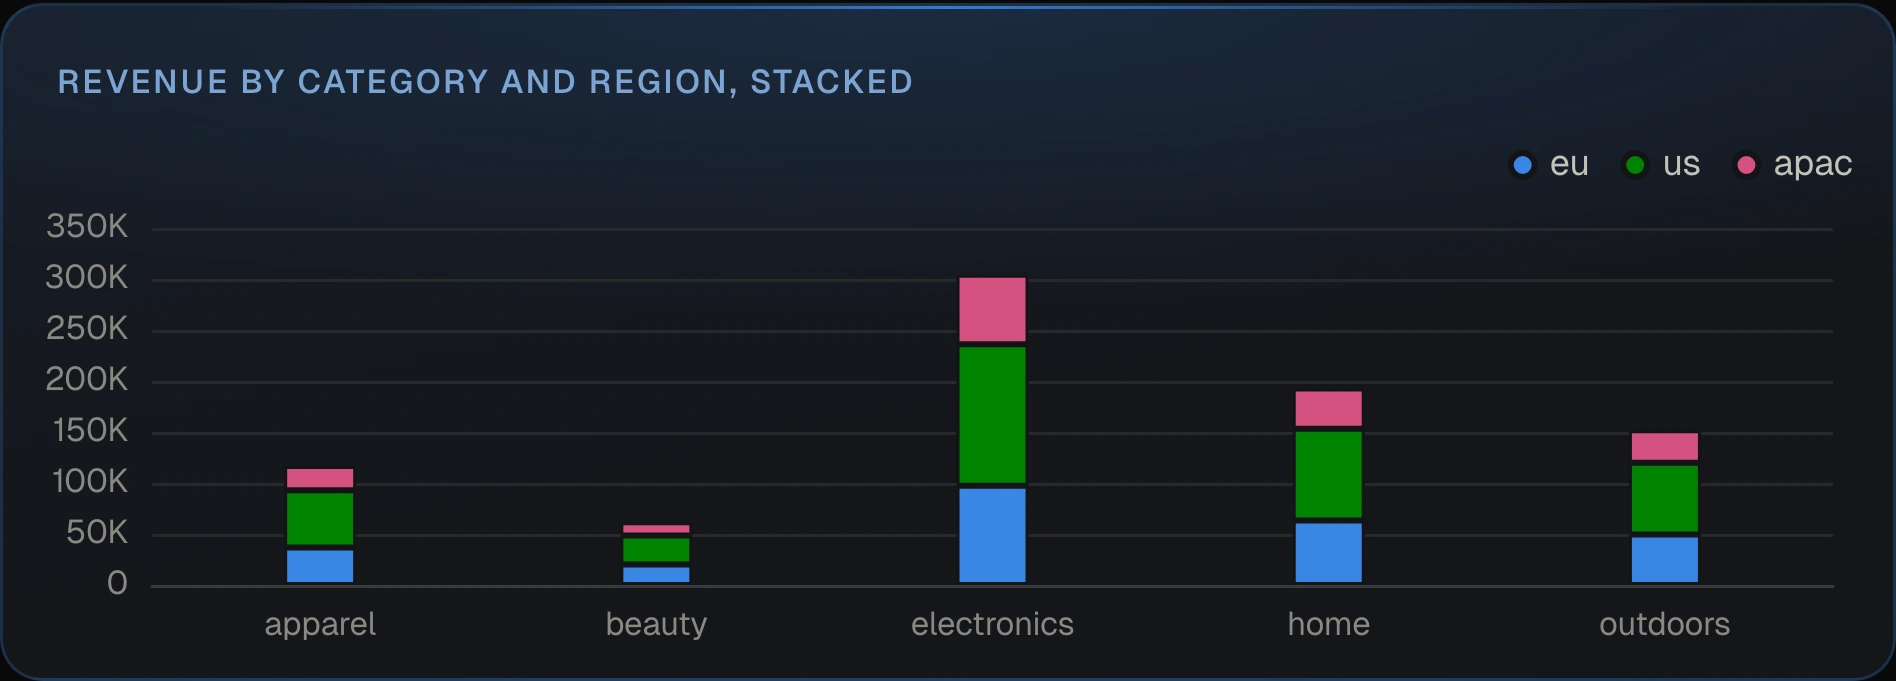
```yaml
- title: Revenue by category and region
chart: {type: bar, group_by: region, stacked: true}
sql: SELECT category, region, ROUND(SUM(amount), 2) AS revenue FROM orders GROUP BY 1, 2
```
A bar chart with a date on the x axis draws one bar per date.
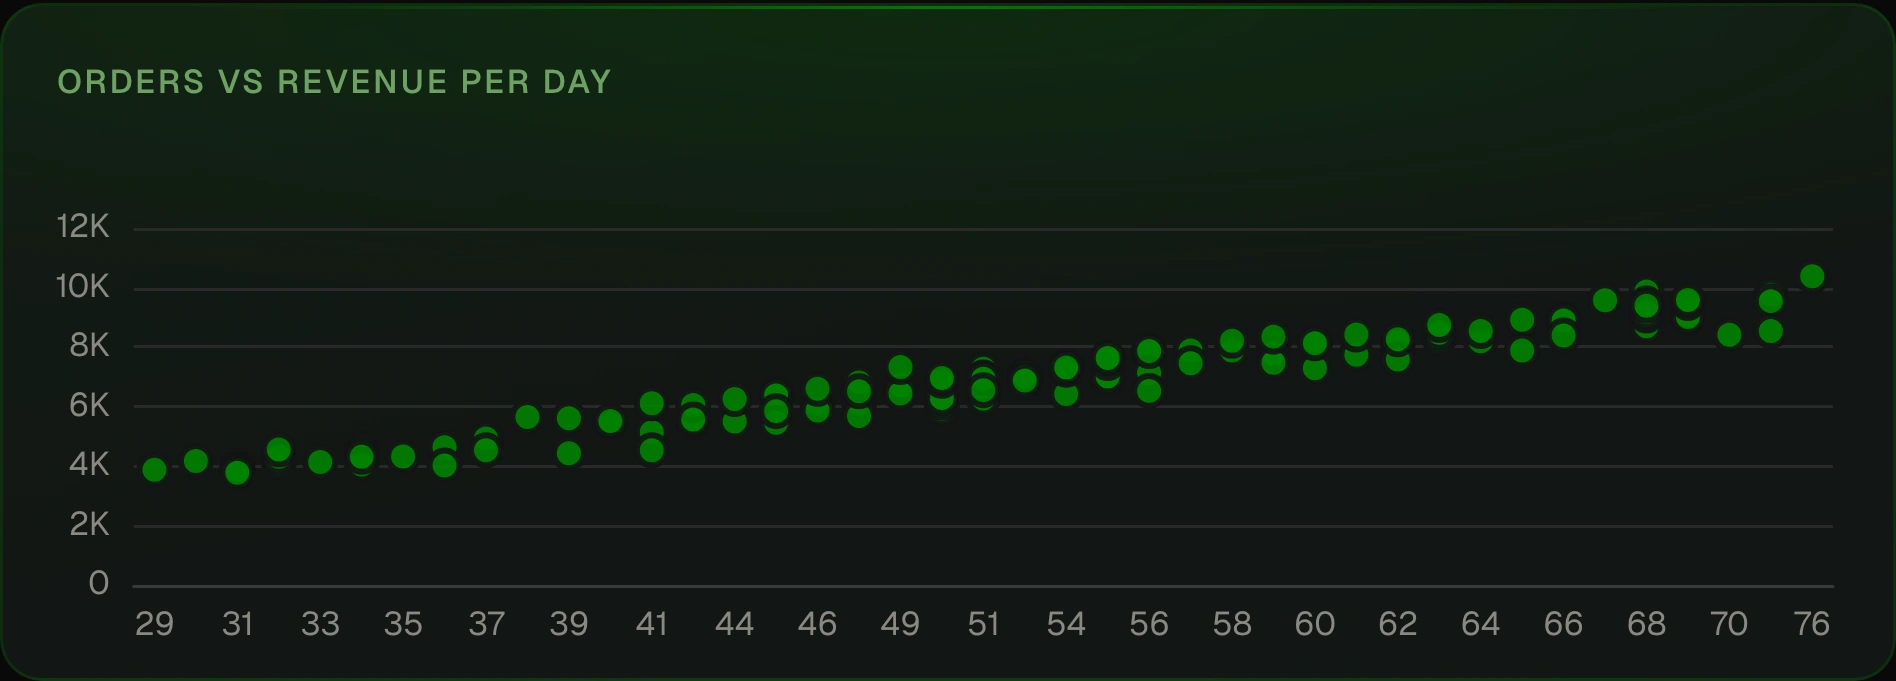
### Scatter
A scatter plots one number against another, one dot per row. Name both axes, because two
number columns are otherwise both treated as values. The x values are drawn in row
order, so sort by the x column.
```yaml
- title: Orders vs revenue per day
chart: {type: scatter, x: orders, y: revenue}
sql: |
SELECT COUNT(*) AS orders, ROUND(SUM(amount), 2) AS revenue
FROM orders GROUP BY order_date ORDER BY orders
```
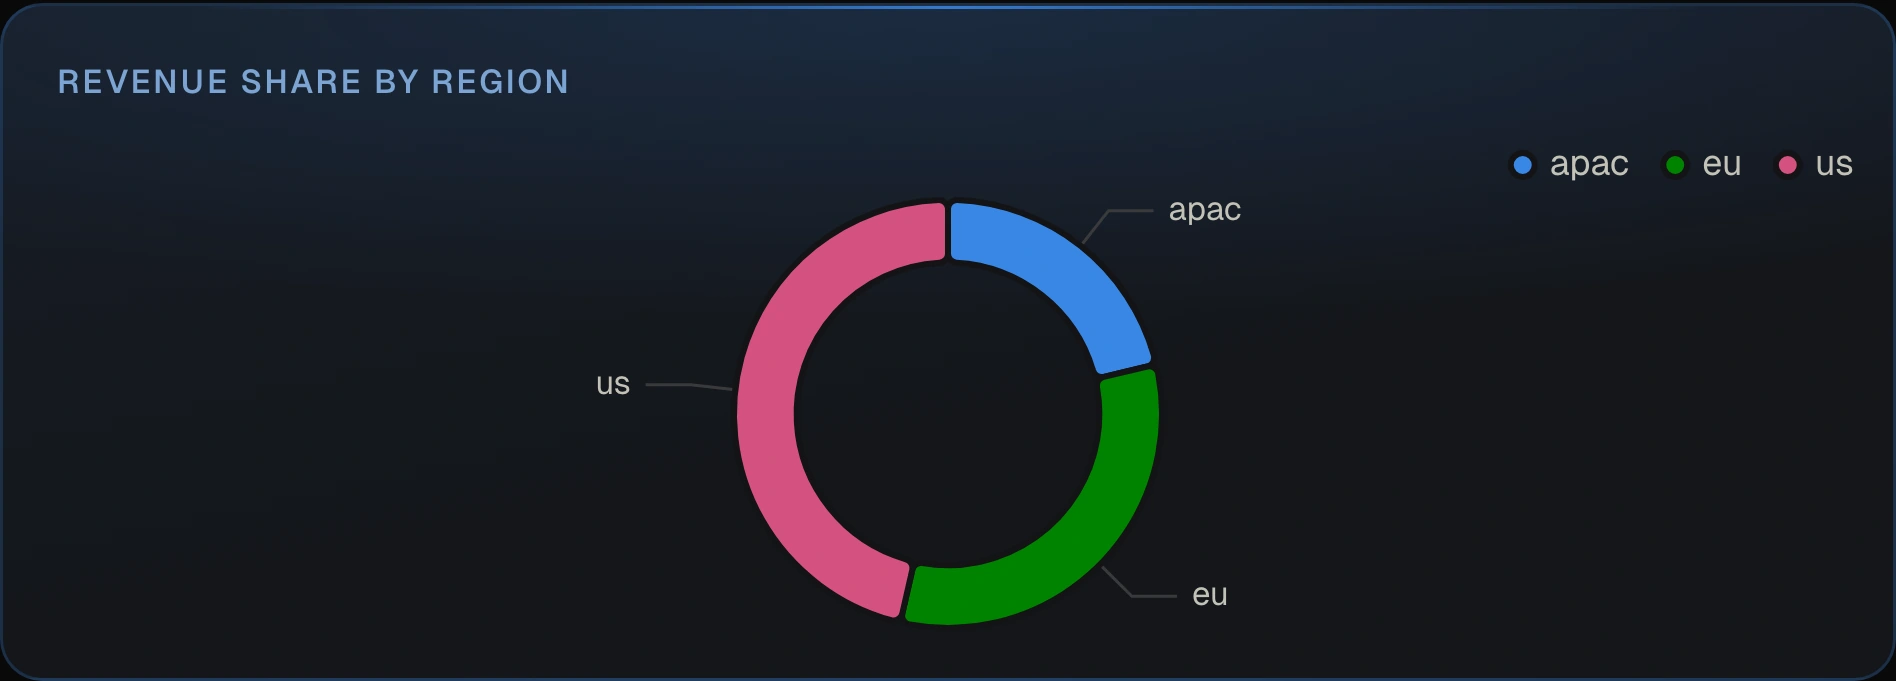
### Pie
A pie shows each row's share of the total, drawn as a donut. It needs one label column
and one number column. Keep it to a handful of slices.
```yaml
- title: Revenue share by region
chart: pie
format: currency
sql: SELECT region, ROUND(SUM(amount), 2) AS revenue FROM orders GROUP BY 1
```
Set `label` and `value` to pick the columns yourself.
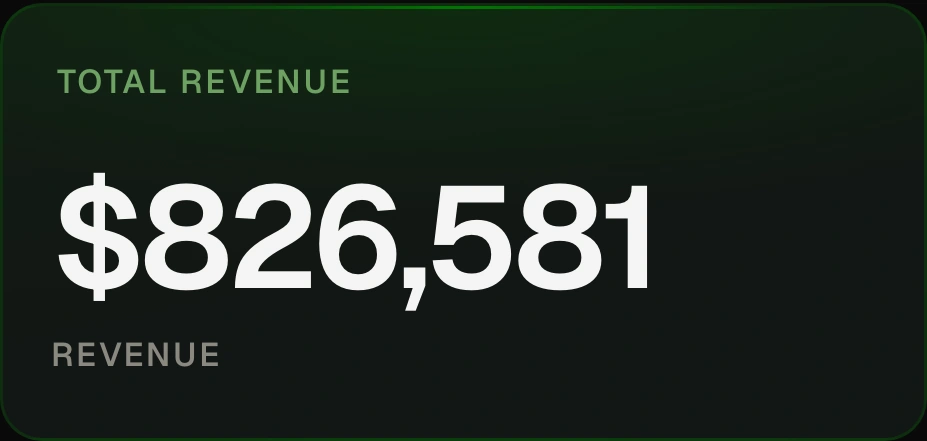
### Big number
A big number shows a single value from the first row, with the column name underneath.
It suits totals and headline metrics. On a metric tile, add `compare:` to show the
change from the previous period.
```yaml
- title: Total revenue
chart: big_number
format: currency
sql: SELECT ROUND(SUM(amount), 2) AS revenue FROM orders
```
Set `value` to choose which column to show.
### Table
A table shows every column and row. Click a column heading to sort. It is the default
when a tile has no `chart:`.
```yaml
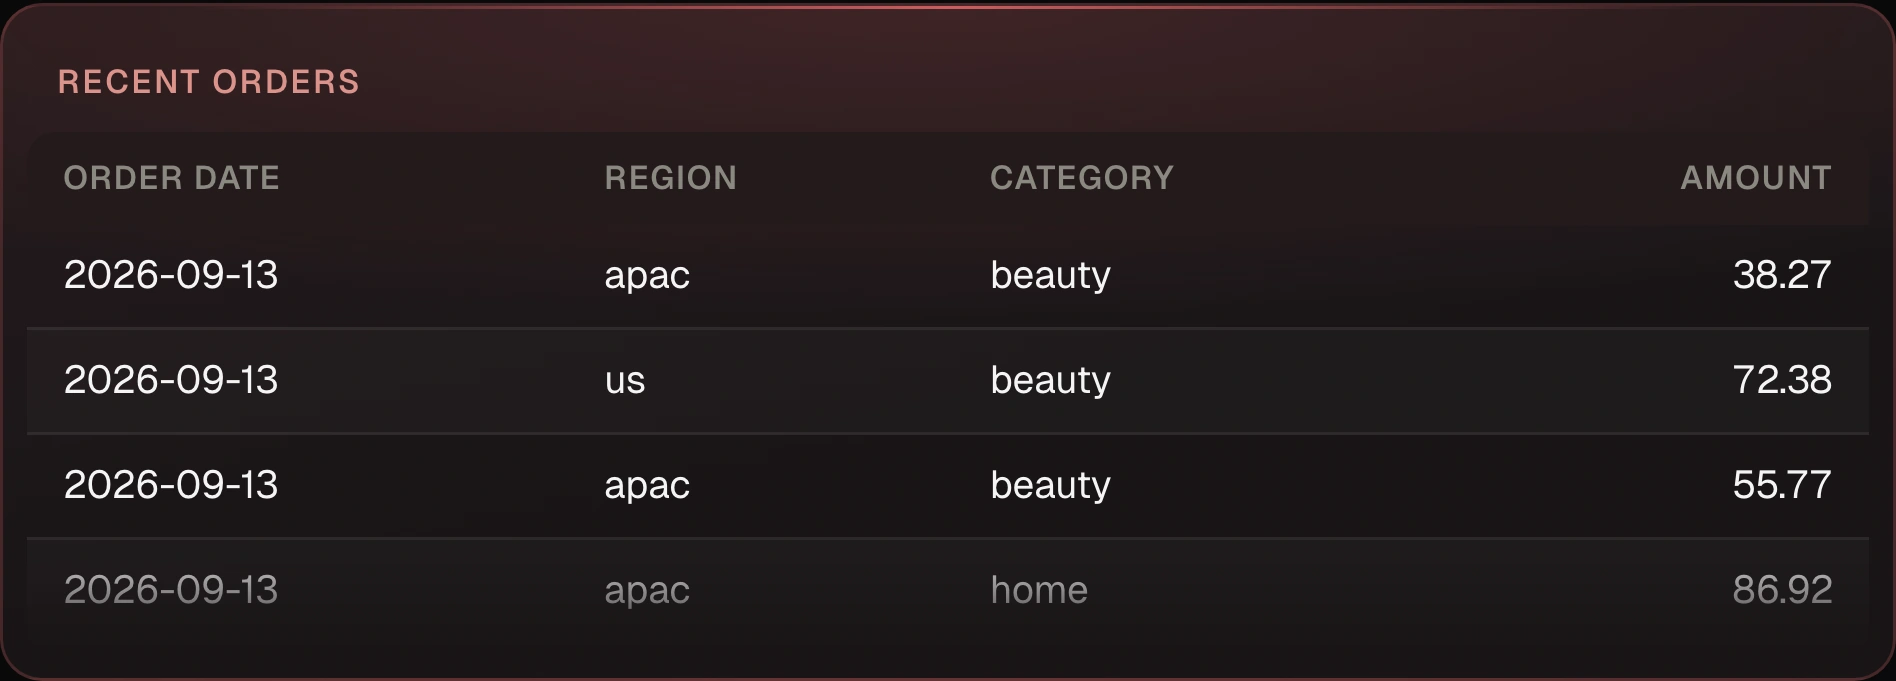
- title: Recent orders
sql: SELECT order_date, region, category, amount FROM orders ORDER BY order_date DESC LIMIT 50
```
### Chart options
| option | charts | what it does |
| --- | --- | --- |
| `type` | all | `line`, `area`, `bar`, `scatter`, `pie`, `big_number`, or `table`. |
| `x` | line, area, bar, scatter | The column on the x axis. |
| `y` | line, area, bar, scatter | One column or a list of columns to plot as values. |
| `group_by` | line, area, bar, scatter | Splits one value column into a series per distinct value of this column. |
| `stacked` | bar | Stacks the series instead of placing them side by side. Areas always stack. |
| `orientation` | bar | `horizontal` draws the bars sideways. |
| `color_by` | bar | `value` shades a single series by size. |
| `label`, `value` | pie | The slice label column and the size column. |
| `value` | big number | The column to show. |
| `legend` | line, area, bar, scatter, pie | `false` hides the legend. |
| `format` | all | How to format values. See Formatting below. |
`chart: bar` is shorthand for `chart: {type: bar}`. Use the long form when you want to set
any other option.
## Layout
Tiles flow left to right in file order on a 12-column grid, wrapping to the next row
when a row fills up. `size:` sets the footprint as width by height, so `6x4` is half the
width and four rows tall. A tile without a size is `6x4`.
```yaml
tiles:
- {title: Revenue, metric: revenue, size: 3x2}
- {title: Orders, metric: order_count, size: 3x2}
- {title: Revenue by day, metric: {name: revenue, grain: day}, chart: area, size: 6x2}
```
When you drag or resize a tile in the browser, sqldash writes an exact
`position: {x, y, w, h}` for it and leaves every other line alone, so the diff stays
small. Tiles with a position stay exactly where they are, and tiles without one flow in
file order below them.
`layout: {row_height: 84}` changes the height of one grid row.
## Edit in the browser
Every change you make in the browser is written back to the YAML file, so it shows up as
an ordinary diff you can review.
**+ Explore** in the top bar is where new tiles come from. It opens the query workspace,
where you write SQL or pick a metric, look at the result, chart it, and click **Add to
dashboard**. See [Explore](/docs/explore/).
**Edit** changes the dashboard in place. You can drag and resize tiles, add or remove
filters, and delete tiles. The pencil on a tile opens it in the tile editor, where you
change its SQL, text, or metric, its dimensions and grain, and its chart type, run it to
preview, and click **Save tile**. For changes you would rather describe than click, use
[AI Studio](/docs/studio/).
## Filters
Filters are the controls at the top of a dashboard. Each one has a `name`, a `type`, and
an optional `label` and `default`. Queries read a filter's value with `{{ name }}`.
```yaml
filters:
- {name: dates, type: daterange, label: Period, default: last_30_days}
- {name: region, type: select, label: Region, options: [us, eu, apac]}
- {name: channel, type: select, options_sql: "SELECT DISTINCT channel FROM orders"}
- {name: min_amount, type: number, label: Minimum order, default: 0}
- {name: customer, type: text, label: Customer email}
- {name: as_of, type: date, label: As of, default: today}
```
| type | what it is |
| --- | --- |
| `daterange` | A start and end date. A filter named `dates` gives queries `{{ dates_start }}` and `{{ dates_end }}`. |
| `date` | A single date. |
| `select` | A dropdown. Takes a fixed `options` list, or `options_sql` to load choices from a query, which also adds an `all` choice. |
| `number` | A number input. |
| `text` | A free text input. This is the type when you leave `type` out. |
Filters also apply to metric tiles. A filter whose name matches one of the metric's
dimensions filters that dimension, and a `daterange` becomes the metric's time range.
### Using filter values in SQL
`{{ name }}` is always sent to the database as a query parameter, never pasted into the
SQL text, so a filter value can never change the query itself.
Write the placeholder unquoted, as in `region = {{ region }}`. A quoted
`'{{ region }}'` is refused by name, because a bound value cannot reach inside a string
literal and sqldash will not paste text into one. For a `LIKE` pattern, build the
pattern in SQL, as in `name LIKE '%' || {{ search }} || '%'`.
When a filter has no value, wrap the condition in `{% if name %}…{% endif %}` and it
drops out of the query. A select sitting on `all` counts as no value.
```sql
SELECT category, SUM(amount) AS revenue
FROM orders
WHERE order_date BETWEEN {{ dates_start }} AND {{ dates_end }}
{% if region %}AND region = {{ region }}{% endif %}
{% if min_amount %}AND amount >= {{ min_amount }}{% endif %}
GROUP BY 1
```
A block can also have `{% elif other %}` branches and an `{% else %}` fallback. The
first branch whose filter has a value wins, `{% else %}` runs when none do, and every
branch binds its own values the same way.
```sql
{% if region %}SELECT * FROM orders WHERE region = {{ region }}
{% elif country %}SELECT * FROM orders WHERE country = {{ country }}
{% else %}SELECT * FROM orders{% endif %}
```
The condition is always a bare filter name. Comparisons, `not`, a block inside another
block, loops, and every other Jinja tag are refused by name before the warehouse sees
the query, on purpose, so the SQL stays readable and safe.
## Dates
Anywhere a date goes, you can write an ISO date like `2026-08-01` or a relative token.
| token | means |
| --- | --- |
| `today` | Today. |
| `-30d`, `-4w`, `-6m`, `-1y` | That many days, weeks, months, or years back. |
| `last_30_days` | The same as `-30d`. |
| `mtd`, `ytd` | The start of this month or this year. |
A token names a window, and it resolves to the edge of that window that fits where you
use it. As a start, `-30d` means 30 days ago. As an end, it means today. To end a range
in the past, use an ISO date.
Tokens resolve against the date on the machine running sqldash, never the viewer's
laptop, so a tile, the CLI, and MCP all run the same window for the same token.
## Period comparison
Add `compare:` to a metric tile to show how the current window compares with an earlier
one.
```yaml
- title: Revenue
metric: revenue
compare: previous_period
- title: Revenue by day
metric: {name: revenue, grain: day}
chart: line
compare: yoy
```
`previous_period` compares with the window of the same length just before, and `yoy`
compares with the same window a year earlier. Big numbers show the change with an arrow,
and time series draw the earlier window as a dashed line. The earlier window is the
dashboard's date range shifted back, so the dashboard needs a `daterange` filter. Without
one, `sqldash lint` reports an error and the tile shows it instead of a number with no
change. The same comparison works in
`sqldash metric query --compare` and in the MCP `query_metric` tool, with no SQL to write.
## Formatting
`format:` controls how numbers display. It takes `number`, `currency`, `percent`,
`compact`, `date`, or any ISO 4217 currency code such as `EUR`.
```yaml
currency: EUR
locale: de-DE
tiles:
- {title: Revenue, metric: revenue, format: currency}
- title: Orders by region
sql: SELECT region, SUM(amount) AS revenue, COUNT(*) AS orders FROM orders GROUP BY 1
format: {revenue: currency, orders: compact}
```
`format: currency` uses the dashboard's `currency:`, which defaults to USD. A mapping
formats each column separately. `locale:` sets separators and date style for everyone,
overriding the viewer's browser. A metric's `format:` in `metrics.yaml` carries over to
its tiles automatically.
## Validate before you commit
```bash
sqldash lint # checks every dashboard, metric, and agent
sqldash lint --strict # also probes the warehouse and fails on warnings, for CI
```
Lint catches unknown keys, missing metrics and dimensions, broken filter references,
plaintext secrets, and missing drivers, so a broken dashboard fails the pull request
instead of the page. Plain `lint` never opens a warehouse. `--strict` does, and runs
every `metrics.yaml` metric and every agent SQL tool wrapped in `WHERE 1 = 0`, so an expression or column the
warehouse cannot resolve fails CI with the warehouse's own error and no rows come back.
---
# Explore
**+ Explore** opens the query workspace, where you write SQL against a dashboard's
connections, look at the results, chart them, and add the chart to the dashboard as a
tile. It is how new tiles get made in the browser. The pencil on an existing tile still
opens that one tile for direct editing.
On a dashboard, **+ Explore** sits in the top bar next to **Edit**. On the dashboard
list it opens the workspace for the only dashboard, or asks which one to use when there
are several, because a dashboard supplies the connections, the filter definitions, and
the destination for new tiles.
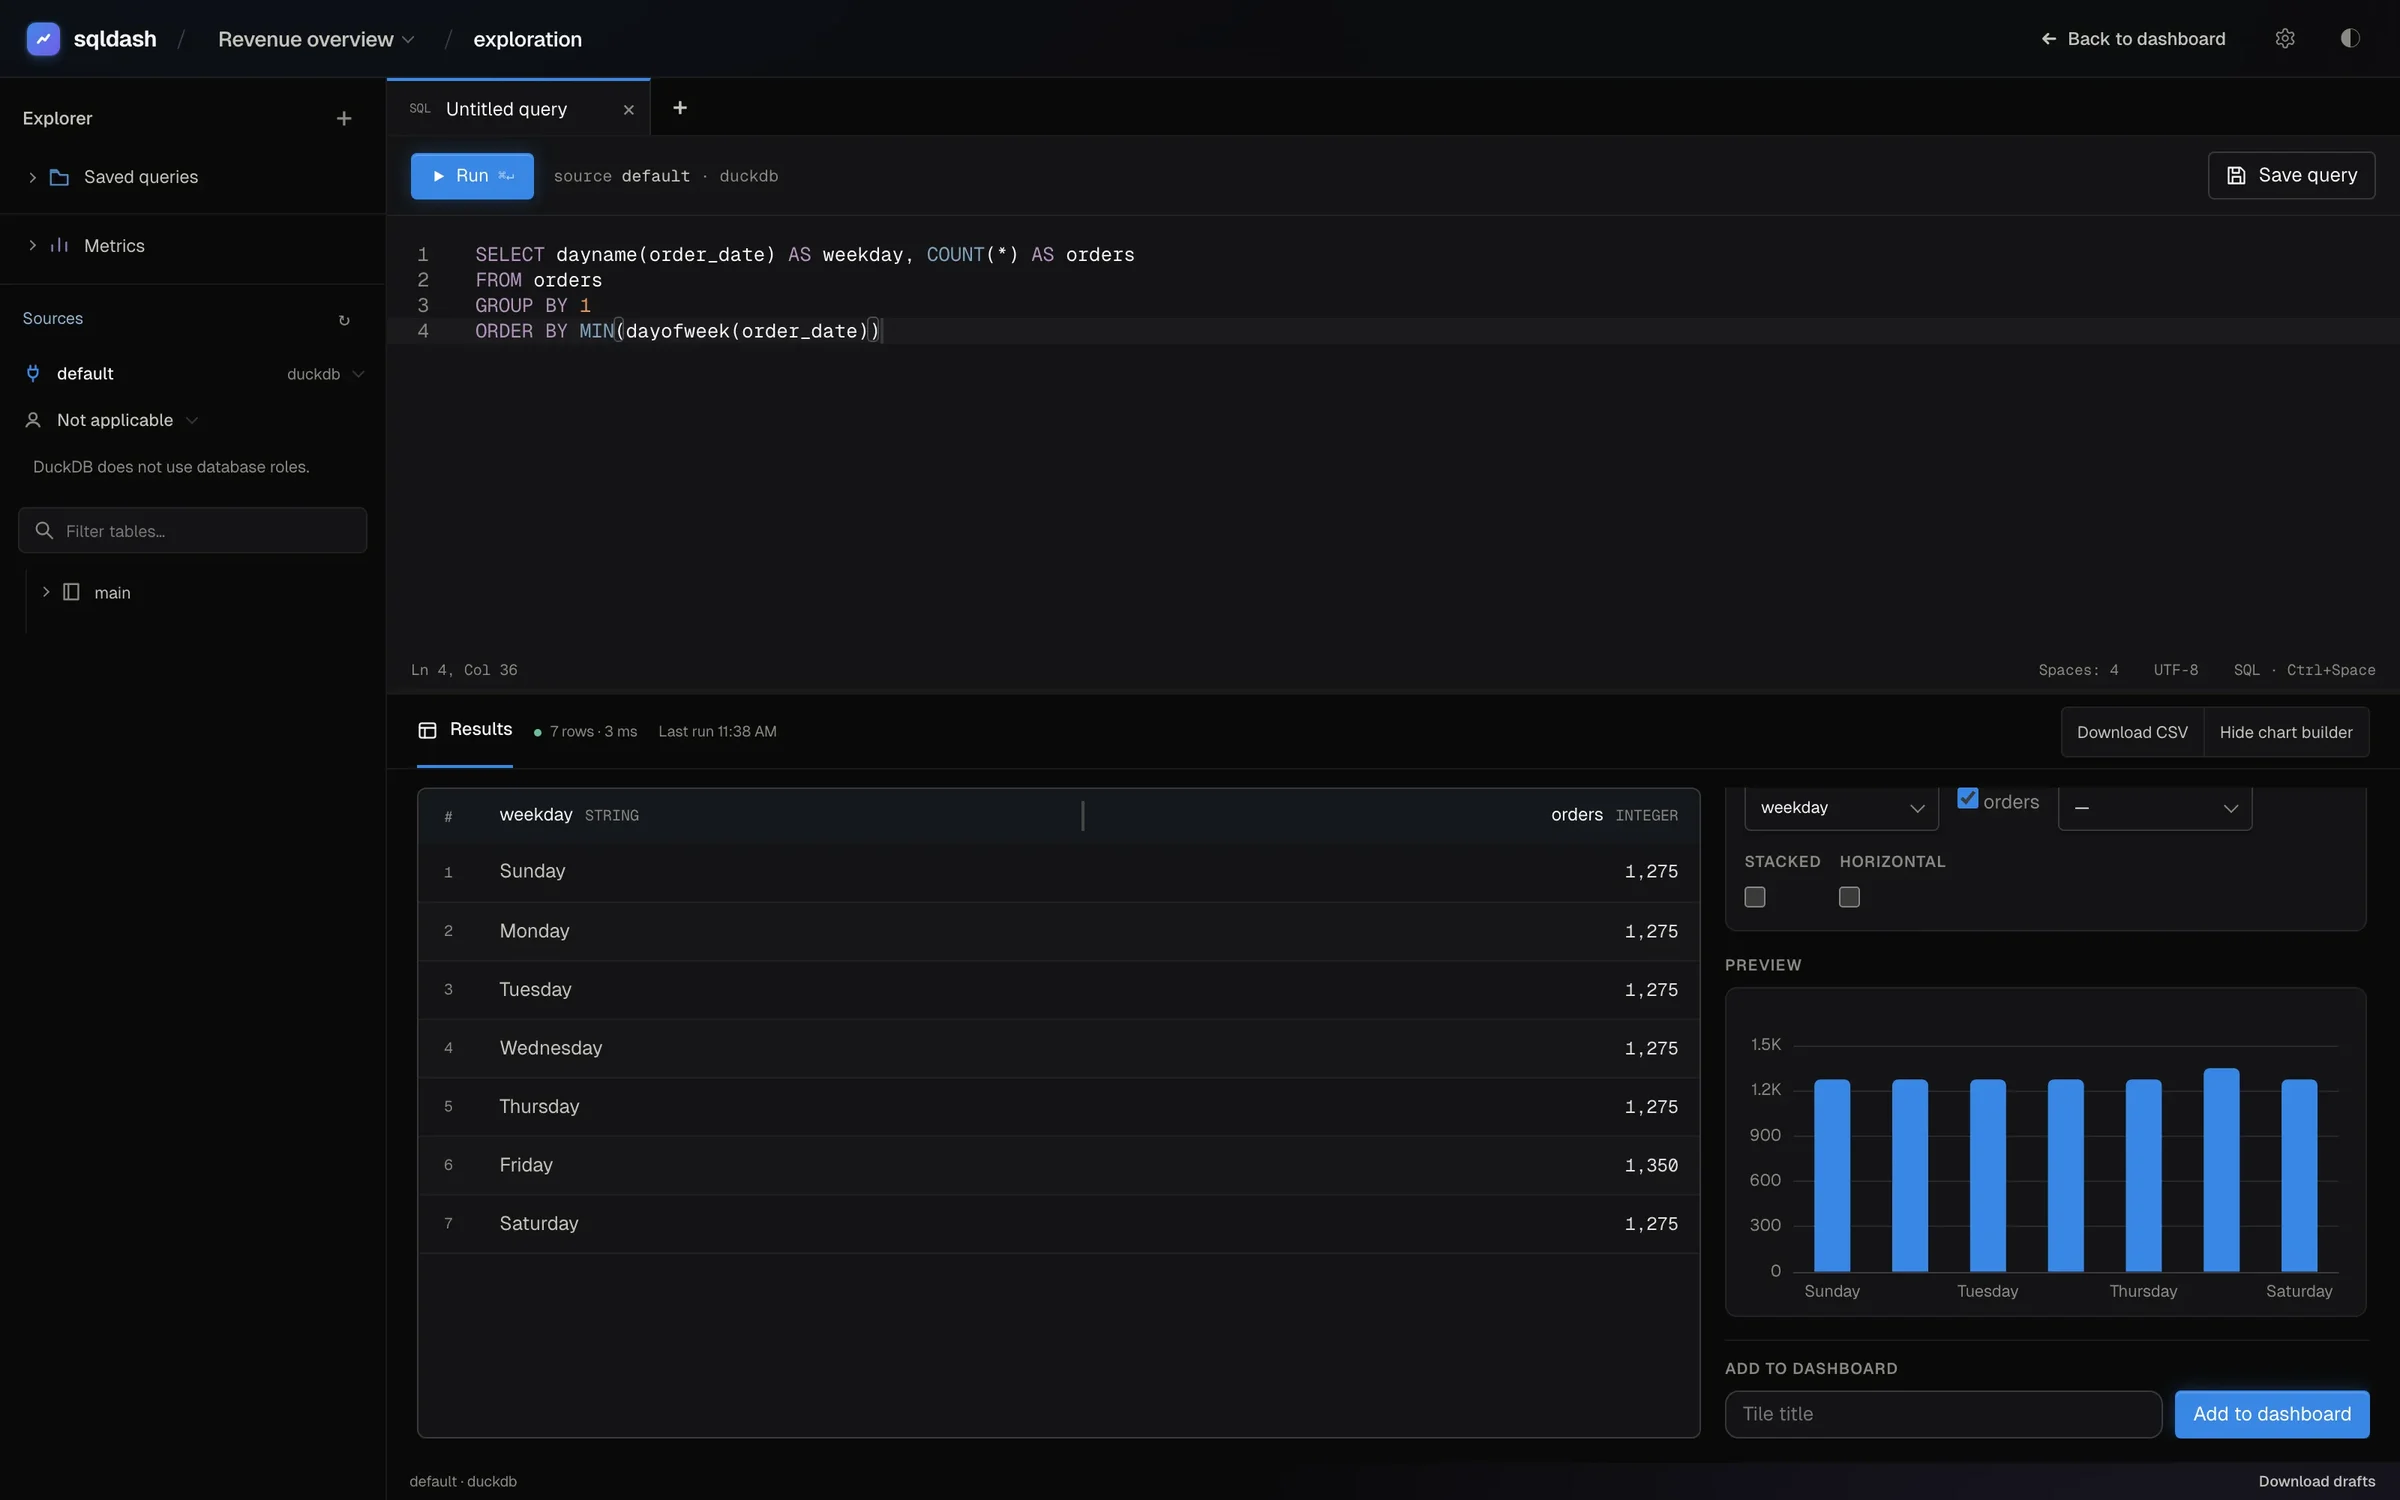
An orders-by-weekday query, charted as bars and ready to add to the dashboard
### Write and run a query
The workspace opens with a query tab. Type SQL and press **Run**, or ⌘⏎ (Ctrl⏎ on Linux).
```sql
SELECT region, ROUND(SUM(amount), 2) AS revenue
FROM orders
GROUP BY region
ORDER BY revenue DESC
```
The sidebar's **Sources** section lists the tables and columns of the selected
connection. Filter it by name, and click a table or column to insert it at the cursor.
**Metrics** lists the project's governed metrics, and picking one opens a **Metric**
tab where you choose its dimensions and grain, so a tile built from it stays tied to
the definition rather than to copied SQL.
A tab can also be a **Text** tab for a markdown tile, and **Download CSV** saves the
result of the current run.
### Chart it and add it to the dashboard
Beside the results, the chart builder picks a chart type and its columns. Name the tile
and click **Add to dashboard**. The tile lands in the dashboard's YAML with the query and
chart settings, as an ordinary diff.
The tab stays open after you add it. Choose another chart type and click **Add another
tile** to put a second view of the same result on the dashboard. Both tiles reference
one SQL definition, each with its own chart settings.
### Save it for later
**Save query** keeps the SQL in the project's query library without creating a tile.
The library appears under **Saved queries** in the sidebar, grouped by connection, and
any dashboard in the same project can open it, as long as the connection and the filter
definitions the query needs are compatible.
## Where things are kept
| what | where |
| --- | --- |
| Open tabs and drafts | Your browser's local storage, scoped to the project and dashboard. Up to twenty tabs. |
| Saved queries | `.sqldash/queries/.yaml` in the project, with readable SQL, a title, the source reference, and the filter definitions it needs. |
| Tiles you add | The dashboard's own YAML, under `queries:` and the tile's `query:`. |
Drafts survive a reload, including their SQL, source, and chart settings, but results
never run on their own after a reload. **Download drafts** saves them as a file when the
browser cannot keep them. Closing a tab that is still running cancels its query.
Adding a saved query to a dashboard copies its SQL and source into that dashboard
rather than linking to the library file. Renaming or deleting a library query leaves
those copies alone. When you edit SQL that several tiles share, the workspace lists the
tiles that use it and offers a copy for the current tile, so an edit never repoints a
tile you did not mean to change.
## Pick the role, database, and warehouse
The **Sources** section starts with a connection picker, which lists the dashboard's
connections and the project's. Under it, a **Role** picker shows the roles the
connection can switch to, on the engines that have session roles, which are Snowflake,
Postgres, MySQL, MariaDB, Trino, and ClickHouse over HTTP. SQL Server and Redshift show the roles that
apply without offering a switch, and DuckDB, SQLite, BigQuery, Athena, and Databricks
say what governs access instead.
On Snowflake the section also has **Database** and **Warehouse** pickers, and the role
picker is labelled **Primary role**. What you pick applies to the current tab only. See
[Sources](/docs/sources/#pick-a-role-database-and-warehouse) for how each one behaves,
including what happens when a role cannot use the connection's warehouse or database.
A tile added from a tab with a picked role, database, or warehouse keeps that choice.
The connection is copied into the dashboard's `source:` map under a name that says what
was picked, with the role, database, and warehouse written into it, so the tile runs the
same way for everyone who serves the dashboard.
## Who can run what
Anyone who can load a served dashboard can type SQL here, with the credentials of the
person running `sqldash serve`. On a warehouse, that credential's grants are the
boundary. A DuckDB source has no credential of its own, so sqldash confines it to the
project's own folders, as described in [Sources](/docs/sources/#duckdb-reads-only-the-project).
---
# Metrics
Define each metric once in a `metrics.yaml` next to your dashboards. The same
definition powers dashboard tiles, the CLI, agents over MCP, and exports to other BI
tools, so nobody re-derives revenue in raw SQL.
```yaml
source: {type: duckdb, attach_files: true}
relations:
orders:
table: orders
metrics:
revenue:
title: Revenue
description: Total order revenue in USD
relation: orders
expr: SUM(amount)
format: currency
synonyms: [sales, turnover]
time_dimension: {name: order_date, grain: day}
dimensions: [{name: region, description: Sales region}, {name: category}]
order_count:
relation: orders
expr: COUNT(*)
time_dimension: {name: order_date, grain: day}
dimensions: [{name: region}, {name: category}]
avg_order_value:
title: Average order value
derived: "{revenue} / NULLIF({order_count}, 0)"
format: currency
trailing_28d_revenue:
relation: orders
expr: SUM(amount)
window: 28 days
time_dimension: {name: order_date, grain: day}
```
## Defining a metric
Every metric starts from one base, which is a `relation:` from the `relations:` map, a
`table:`, or `sql:`. It then aggregates with `expr:` (any SQL aggregate) or with
`derived:`, a formula over other metrics such as
`"{revenue} / NULLIF({order_count}, 0)"`.
Add `time_dimension: {name, grain}` to allow time series. Grains are `hour`, `day`,
`week`, `month`, `quarter`, and `year`.
`dimensions:` lists what the metric may be grouped or filtered by. Queries can only
use declared dimensions, and that is the governance. `filters:` holds SQL conditions
that always apply, such as `status = 'complete'`.
`cumulative: true` turns a metric into a running total, and `window: 28 days` makes it
a trailing aggregate per bucket. Both need a `time_dimension`.
A `derived` metric combines plain metrics on one relation. A component that carries
`filters`, `window`, or `cumulative` is refused, because only its `expr` is inlined.
### Time zones on Snowflake
On Snowflake, a time dimension over a `TIMESTAMP_TZ` column needs `timezone: session`.
```yaml
time_dimension: {name: created_at, grain: month, timezone: session}
```
Snowflake truncates a `TIMESTAMP_TZ` at each row's own offset, so without it a month of
rows written from three time zones comes back as three buckets for that month. With it,
sqldash reads the column as `TIMESTAMP_LTZ` before bucketing, and every row is cut in
the session time zone. Leave it off for `DATE`, `TIMESTAMP_NTZ`, and `TIMESTAMP_LTZ`
columns, which already bucket correctly, and on Postgres and DuckDB, which bucket a
`timestamptz` that way on their own. `sqldash lint --strict` reads the column types and
warns about a `TIMESTAMP_TZ` time dimension that does not set it.
### Time buckets inside an expression
When an expression needs a time bucket, write `SQLDASH_TRUNC('', )` instead
of a warehouse's own function.
```yaml
active_weeks:
relation: orders
expr: "COUNT(DISTINCT SQLDASH_TRUNC('week', order_date))"
```
sqldash spells it for whichever warehouse the file points at, so the metric keeps
working after you point `source:` somewhere else. It works in `expr`, `filters`,
dimension and time dimension `expr`, and a relation's `sql:`, with the usual grains.
It is sqldash's own spelling and will not run if you paste it into a tile's SQL or
`run_sql`, but `export lookml` and `export cortex` write the target's real function.
`title`, `description`, `format`, `synonyms`, and `owners` help people and agents find
the right metric.
## In dashboards
A tile names a metric instead of carrying SQL.
```yaml
tiles:
- title: Revenue by region
metric: {name: revenue, grain: month, dimensions: [region]}
chart: {type: line, group_by: region}
- title: Total revenue
metric: revenue
compare: previous_period
```
Dashboard filters bind to metric dimensions by name, and a `daterange` filter becomes
the metric's time range. `compare:` takes `previous_period` or `yoy`.
A dashboard can also define `metrics:` inline so a single file stays portable. An inline
metric runs on the dashboard's own `source:`, so its base has to be in the dashboard file
too. `relation:` resolves against the dashboard's own `relations:`, never against
`metrics.yaml`, so either declare the relation in the dashboard or name the `table:`
directly. A metric that should reuse a project relation belongs in `metrics.yaml`, where
any dashboard can reference it by name.
## From the terminal
```bash
sqldash metric list # the semantic layer at a glance
sqldash metric show revenue # full definition
sqldash metric query revenue -d region -g month --start -90d
sqldash metric query revenue --start -30d --end today --compare previous_period
sqldash metric query revenue -p region=eu -f json
```
Every `list` and `show` takes `--json`.
## One namespace per project
Metric names live in one namespace per project. The project `metrics.yaml` is
canonical. A dashboard may define metrics inline in its own `metrics:` block, and an
inline definition overrides the project one within that dashboard only. A name that
two dashboards each define inline belongs to neither. sqldash refuses it rather than
picking one, `--dashboard` on the CLI says which you mean, and `sqldash lint` fails on
the collision so CI catches it first.
## Names in, SQL out
Callers, whether the UI, the CLI, or an agent, pass metric names, dimension names,
and filter values. They never pass SQL. The compiler binds every value as a query
parameter, so the only verbatim SQL in a query is what the metric's author wrote in
the YAML. Agents reach the same compiler through `query_metric`, described in
[MCP](/docs/mcp/#tools).
---
# Sources
A source tells sqldash how to reach a database. It goes under the `source:` key of a
dashboard or of `metrics.yaml`, and it is always a flat list of fields. There are no
nested auth blocks and no driver-specific sub-schemas, so every engine is configured
the same way.
```yaml
source:
type: snowflake
account: acme-prod
warehouse: WH
database: ANALYTICS
schema: PUBLIC
username: ${env:SNOWFLAKE_USER}
authentication: externalbrowser
```
Never write a password or token into the file. Reference it with `${env:VAR}` or keep
it in a local profile, as described in [Setup](/docs/setup/). `sqldash lint` warns about
a plaintext secret, and `--strict` turns that warning into a failure for CI. It also
flags unknown fields with a did-you-mean hint and tells you which extra to install when
a driver is missing.
## Snowflake
```yaml
source:
type: snowflake
account: acme-prod
warehouse: WH
database: ANALYTICS
schema: PUBLIC
role: ANALYST
username: ${env:SNOWFLAKE_USER}
authentication: externalbrowser
```
| field | required | what it is |
| --- | --- | --- |
| `type` | yes | `snowflake` |
| `account` | yes | Your account identifier, such as `acme-prod` or `xy12345.us-east-1`. |
| `warehouse` | | The virtual warehouse queries run on. |
| `database` | | The default database. |
| `schema` | | The default schema. |
| `role` | | The role to use after signing in. |
| `username` | | The user to sign in as. Usually `${env:VAR}` or a profile. |
| `authentication` | | `externalbrowser`, `password`, `pat`, or `keypair`. |
| `password` | | Used with `authentication: password`. |
| `token` | | A programmatic access token, used with `authentication: pat`. |
| `private_key_path` | | Path to a private key file, used with `authentication: keypair`. |
| `private_key_passphrase` | | The key's passphrase, if it has one. |
| `connect_args` | | Extra settings passed straight to the Snowflake driver. |
`externalbrowser` opens your SSO login in a browser and is the default when no secret is
set. Install the `snowflake` extra.
### A role turns secondary roles off
Snowflake users get `DEFAULT_SECONDARY_ROLES = ALL` unless an admin changed it, and while
secondary roles are active every role granted to the user adds its privileges. Left that
way, `role: REPORTING_READER` would narrow nothing, and a table only your owner role can
read would still be readable through the source.
So when a source sets `role:`, or you pick a role in the query workspace, sqldash runs
`USE SECONDARY ROLES NONE` on every connection right after `USE ROLE`, and the source
gets exactly that role's grants. A source with no role keeps your defaults. If the data
access really comes from secondary roles, such as a primary role that only grants the
warehouse, keep them on explicitly.
```yaml
source: {type: snowflake, account: acme-prod, role: ANALYST, secondary_roles: true}
```
`secondary_roles: false` turns them off even without a `role:`.
### Pick a role, database, and warehouse
The query workspace behind [**+ Explore**](/docs/explore/) has a **Sources** section in
its sidebar. For a Snowflake connection it shows three pickers, and each choice applies
to the current query tab only.
- **Primary role** lists the roles your user can switch to, with their comments, and
notes which secondary roles are active and that picking a role turns them off.
- **Database** lists the databases the role can see and sets where unqualified table
names resolve. The schema browser follows it. A table in another database is still
reachable as `DATABASE.SCHEMA.TABLE`.
- **Warehouse** lists the warehouses the role can see, with their sizes, and sets where
the tab's queries run.
Snowflake keeps the session's warehouse and database across `USE ROLE` but only uses
them while the new role has a privilege on them, so switching to a role that lacks one
would quietly leave the session with no warehouse or no database. sqldash checks after
every switch. When the role cannot use the configured warehouse, it tries up to three
warehouses the role can see, keeps the first that works, and says so under the picker,
as in "ANALYST cannot use warehouse WH, so queries run on REPORTING_WH." The database
falls back the same way, trying the account's own databases before shared and
application ones. When nothing the role can see works, the picker says so and asks you
to pick another role.
A tile added from that tab keeps the choice. See [Explore](/docs/explore/) for how it is
written into the dashboard.
Other engines get a **Role** picker where they have session roles, which covers
Postgres, MySQL 8.0.19 and newer, MariaDB, Trino, and ClickHouse 24.4 and newer over its
HTTP driver. SQL Server and Redshift apply all granted roles together, so the picker
lists them without offering a switch. DuckDB, SQLite, BigQuery, Athena, and Databricks
have no session roles, and the sidebar names what governs access instead, such as
Google Cloud IAM or Unity Catalog grants. The database and warehouse pickers are
Snowflake only.
## BigQuery
```yaml
source:
type: bigquery
project: acme-analytics
database: warehouse
```
| field | required | what it is |
| --- | --- | --- |
| `type` | yes | `bigquery` |
| `project` | yes | The Google Cloud project that runs and bills the queries. |
| `database` | | The default dataset. |
| `options` | | Extra connection settings, such as `credentials_path` for a service account key. |
sqldash signs in with Google Application Default Credentials, so run `gcloud auth application-default login` once,
or point at a service account key with `options: {credentials_path: /path/to/key.json}`.
Install the `bigquery` extra.
## Databricks
```yaml
source:
type: databricks
host: dbc-1234.cloud.databricks.com
http_path: /sql/1.0/warehouses/abc123
catalog: main
schema: analytics
token: ${env:DATABRICKS_TOKEN}
```
| field | required | what it is |
| --- | --- | --- |
| `type` | yes | `databricks` |
| `host` | yes | The workspace host, without `https://`. |
| `http_path` | yes | The SQL warehouse's HTTP path. |
| `token` | yes | A personal access token. Use `${env:VAR}` or a profile. |
| `catalog` | | The default Unity Catalog catalog. |
| `schema` | | The default schema. |
| `port` | | Defaults to 443. |
Copy the host and HTTP path from the SQL warehouse's connection details page in
Databricks. Install the `databricks` extra.
## Redshift
```yaml
source:
type: redshift
host: acme.abc123.us-east-1.redshift.amazonaws.com
port: 5439
database: analytics
username: ${env:REDSHIFT_USER}
password: ${env:REDSHIFT_PASSWORD}
```
| field | required | what it is |
| --- | --- | --- |
| `type` | yes | `redshift` |
| `host` | yes | The cluster or workgroup endpoint. |
| `port` | | Usually 5439. |
| `database` | yes | The database to connect to. |
| `username` | yes | The database user. |
| `password` | yes | The user's password. |
Install the `redshift` extra.
## Athena
```yaml
source:
type: athena
host: us-east-1
schema: analytics
options: {s3_staging_dir: "s3://acme-athena-results/"}
```
| field | required | what it is |
| --- | --- | --- |
| `type` | yes | `athena` |
| `host` | yes | The AWS region, such as `us-east-1`, or a full Athena endpoint. |
| `schema` | yes | The Athena database to query. |
| `options` | yes | Must include `s3_staging_dir`, the S3 location for query results. |
| `username` | | An AWS access key id. Leave it out to use your default AWS credentials. |
| `password` | | The matching secret access key. |
Install the `athena` extra.
## Postgres, MySQL, and MariaDB
```yaml
source:
type: postgres
host: db.internal
port: 5432
database: analytics
username: ${env:PGUSER}
password: ${env:PGPASSWORD}
```
| field | required | what it is |
| --- | --- | --- |
| `type` | yes | `postgres`, `mysql`, or `mariadb` |
| `host` | yes | The database host. |
| `port` | | Defaults to the engine's usual port. |
| `database` | yes | The database to connect to. |
| `username` | yes | The database user. |
| `password` | | The user's password. |
| `options` | | Extra URL settings, such as `sslmode: require` for Postgres. |
Use `type: mysql` or `type: mariadb` with the same fields. Install the `postgres` or
`mysql` extra.
## SQL Server
```yaml
source:
type: mssql
host: sql.internal
port: 1433
database: analytics
username: ${env:MSSQL_USER}
password: ${env:MSSQL_PASSWORD}
options: {driver: "ODBC Driver 18 for SQL Server"}
```
| field | required | what it is |
| --- | --- | --- |
| `type` | yes | `mssql` |
| `host` | yes | The server host. |
| `port` | | Usually 1433. |
| `database` | yes | The database to connect to. |
| `username` | yes | The database user. |
| `password` | | The user's password. |
| `options` | yes | Must include `driver`, the name of the installed ODBC driver. |
SQL Server connects through `pyodbc`, so install `pyodbc` alongside sqldash along with
an ODBC driver for SQL Server.
## Trino and ClickHouse
```yaml
source:
type: trino
host: trino.internal
port: 8080
database: hive
username: ${env:TRINO_USER}
```
| field | required | what it is |
| --- | --- | --- |
| `type` | yes | `trino` or `clickhouse` |
| `host` | yes | The server host. |
| `port` | | The server port. |
| `database` | | For Trino the catalog, for ClickHouse the database. |
| `username` | | The user to connect as. |
| `password` | | The user's password, if the server requires one. |
Install the `trino` or `clickhouse` extra.
## DuckDB and SQLite
```yaml
source:
type: duckdb
database: analytics.duckdb
```
| field | required | what it is |
| --- | --- | --- |
| `type` | yes | `duckdb` or `sqlite` |
| `database` | | A file path relative to the project, or `:memory:`, which is the default. |
| `attach_files` | | DuckDB only. `true` turns local CSV and Parquet files into views. |
| `base_dir` | | DuckDB only. The folder the source's files resolve against, instead of the dashboard's own folder. |
| `external_access` | | DuckDB only. `true` lets SQL read files outside the project. Off by default. |
Neither needs an extra.
### Query local CSV and Parquet files
```yaml
source: {type: duckdb, attach_files: true}
```
With `attach_files: true`, every `.csv` and `.parquet` file next to the dashboard, and
in its `data/` folder, becomes a view named after the file. You can then query it
directly.
```sql
SELECT category, SUM(amount) FROM orders GROUP BY 1
```
That is how the demo works. Commit a small extract next to a dashboard and anyone who
clones the repo can reproduce it. Only local folders are scanned. Remote object
storage is not attached.
### DuckDB reads only the project
A warehouse source is bounded by the credential it connects with. A DuckDB source has no
credential, and anyone who can load a served dashboard can type SQL into the query
workspace, so sqldash confines a DuckDB source to two folders and everything under them,
the folder holding its `database:` file and the folder its files resolve against. That
second one is `base_dir` when the source sets it and the dashboard's own folder
otherwise. `read_csv`, `read_text`, `read_blob`, and `glob` outside them fail with a
permission error that names what the source is confined to.
If a project genuinely reads files from elsewhere, such as a shared drive or a `.duckdb`
file in another tree, say so on the source.
```yaml
source: {type: duckdb, database: app.duckdb, external_access: true}
```
That switch is not narrow. It hands every viewer of every dashboard on that source the
full file access of whoever runs the server, so prefer pointing `base_dir` at the folder
you want read.
## Any other database
If SQLAlchemy has a dialect for it, sqldash can connect with a raw connection URL.
Write the whole source as the URL.
```yaml
source: "trino://analyst@trino.internal:8080/hive"
```
Keep secrets out of the URL with `${env:VAR}`, as in
`"postgresql+psycopg://${env:PGUSER}:${env:PGPASSWORD}@db.internal/analytics"`.
Inside a map of several sources, give the URL its own field.
```yaml
source:
warehouse: {type: snowflake, account: acme-prod, default: true}
events: {url: "duckdb:///events.duckdb"}
```
## Several sources in one dashboard
A dashboard that reads two databases names each connection.
```yaml
source:
warehouse:
type: snowflake
account: acme-prod
default: true
app_db:
type: postgres
host: db.internal
database: app
```
A tile picks one with `source: app_db`. A tile that names none runs against the entry
marked `default: true`. A map with a single entry needs no mark, but with several
entries and no mark sqldash refuses to guess, because picking by file order would let
a reordering quietly repoint every tile.
`sources:` is the older spelling of this map. Files that use it still load, but new
files should use `source:`.
## Inspect and test
```bash
sqldash source list --json # every source, credentials redacted
sqldash source test # connect and SELECT 1 on each, report latency
sqldash source describe --json # tables and columns, the raw material for metrics
```
## Who can see what
sqldash has no login of its own today. `sqldash serve` runs on your machine with your
credentials, so the warehouse's grants, masking, and audit apply to every query, for
every person. Anyone who can reach the served page can run SQL in the query workspace
with those credentials, which is why `serve` binds to `127.0.0.1` by default.
---
# AI Studio
Point at a tile or filter, describe the change, and send it to the coding agent on
your machine. AI Studio runs the agent headlessly, shows its output as it works, and
lets you review or undo its dashboard edits while you keep chatting. It is part of the
base install.
## Send a request
Open any dashboard served by `sqldash serve` and click **AI Studio**. Claude Code and
Codex appear automatically when their command line tools are installed, signed in, and on
the server's `PATH`. AI Studio runs the CLI, so the Codex or Claude IDE extension on its
own is not enough. Run `sqldash studio list` to see which agents it found.
1. Click **Annotate dashboard**, choose the tile, chart, or title you mean, and write
your note beside it. Use **Add request** for changes that are not tied to one
element.
2. Add any overall instructions in the message box.
3. Open **Included context** to see exactly what goes with the request, then click
**Send to agent**, or press Enter in the message box.
The dashboard updates in place as the agent changes files, keeping your notes and the
conversation open. Keep chatting to refine. Nothing launches until you click
**Send to agent**.
AI Studio supports macOS and Linux. It is on by default when the server binds to a
loopback address and off otherwise, and `sqldash serve --no-studio` turns it off.
## Review and undo
- **View changes** compares the dashboard's YAML files before and after the latest
turn, with connection settings omitted. Use `git diff` for exact text and for CSS.
- **Undo last edit** restores the files the latest turn changed, keeping earlier
edits. Sending again starts a new checkpoint.
- **Stop agent** ends the agent's process group. Review partial edits even when a run
fails or is stopped.
Edits stay on disk without committing or pushing, so the result is an ordinary diff
you review and commit like any other change.
## What the agent receives
The request includes the selected dashboard, tile identifiers, your notes, active
filter values, and metric definitions with connection settings omitted. Under
**Included context**, **Capture screenshot** grabs one frame of the dashboard tab for you
to preview before sending, or you can attach a PNG up to 1 MB. Query results are not
attached, and a request over 100 kB is refused before launch rather than cut short.
Your agent may send that context to a remote model, and it runs with your local
filesystem permissions. AI Studio passes only a small set of environment variables and
does not forward warehouse credentials, cloud tokens, or API keys unless you list them
in the entrypoint's `pass_env`.
## Tool approvals
For Claude Code, permission requests appear in the panel as **Allow once** and
**Deny** cards. **Auto-approve all tools** approves forwarded requests for the rest of
the session. It starts off and resets when you close the session.
For Codex, AI Studio runs `codex exec --skip-git-repo-check --json` with your request,
and Codex decides what it may change using your own Codex settings. AI Studio cannot
relay Codex's interactive approvals, so its choices come from that configuration.
> [!TIP]
> If Codex reports that it cannot write files, allow edits in the workspace by setting
> `sandbox_mode = "workspace-write"` in `~/.codex/config.toml`, or add a custom
> entrypoint that passes the sandbox flag, as shown below. AI Studio never adds
> permission-bypass flags for either agent.
## Custom entrypoints
Use any headless CLI or wrapper. Add one from **Agent settings** in the panel, or from
the terminal.
```bash
sqldash studio add "Codex, can edit" -- codex exec --skip-git-repo-check --sandbox workspace-write '{prompt}'
sqldash studio add "Claude alias" --shell /bin/zsh -- claude-custom -p '{prompt}'
sqldash studio list
sqldash studio check "Codex, can edit" # checks the command resolves, without running it
```
Pass `{prompt}` as its own argument, and AI Studio substitutes the request text. `--shell`
runs a bash or zsh alias or function through a login shell, and `--env KEY=VALUE`
sets a variable for that entrypoint. Entrypoints are saved in your user configuration
directory under `sqldash/studio.json`, outside the repo.
Claude resumes the same conversation on every send. Other entrypoints receive the
latest dashboard context and your new request each turn.
## Style a dashboard
Pin a card and describe the look, such as "Make this revenue card the focal point, with
a violet background and a brighter number." Ask the agent to put styling in the
dashboard's `css:` block and to leave queries, metrics, and filters alone. Styles
refresh in place as the file changes. See [Themes](/docs/themes/) for what the CSS can
reach.
---
# Themes
A dashboard's top-level `css:` block controls its canvas, cards, typography, and chart
colours. It travels with the YAML, so a theme is a normal git diff. Write it yourself,
or ask [AI Studio](/docs/studio/) for it.
## Try the examples
The [sqldash repo](https://github.com/dylan-murray/sqldash/tree/main/examples/studio)
ships six themes written by an agent from a one-line request each, over generated
DuckDB data. Serve them from a checkout.
```bash
git clone https://github.com/dylan-murray/sqldash.git && cd sqldash
sqldash serve examples/studio
```
Open **Neon observatory**, **Electric citrus**, **Ember**, or **Amber terminal** in the
dashboard picker with the app in dark appearance, and **Rose quartz** or **Morning
broadsheet** in light. Every one is the same dashboard with the same metrics. Only the
`css:` block changes, as in this before and after.
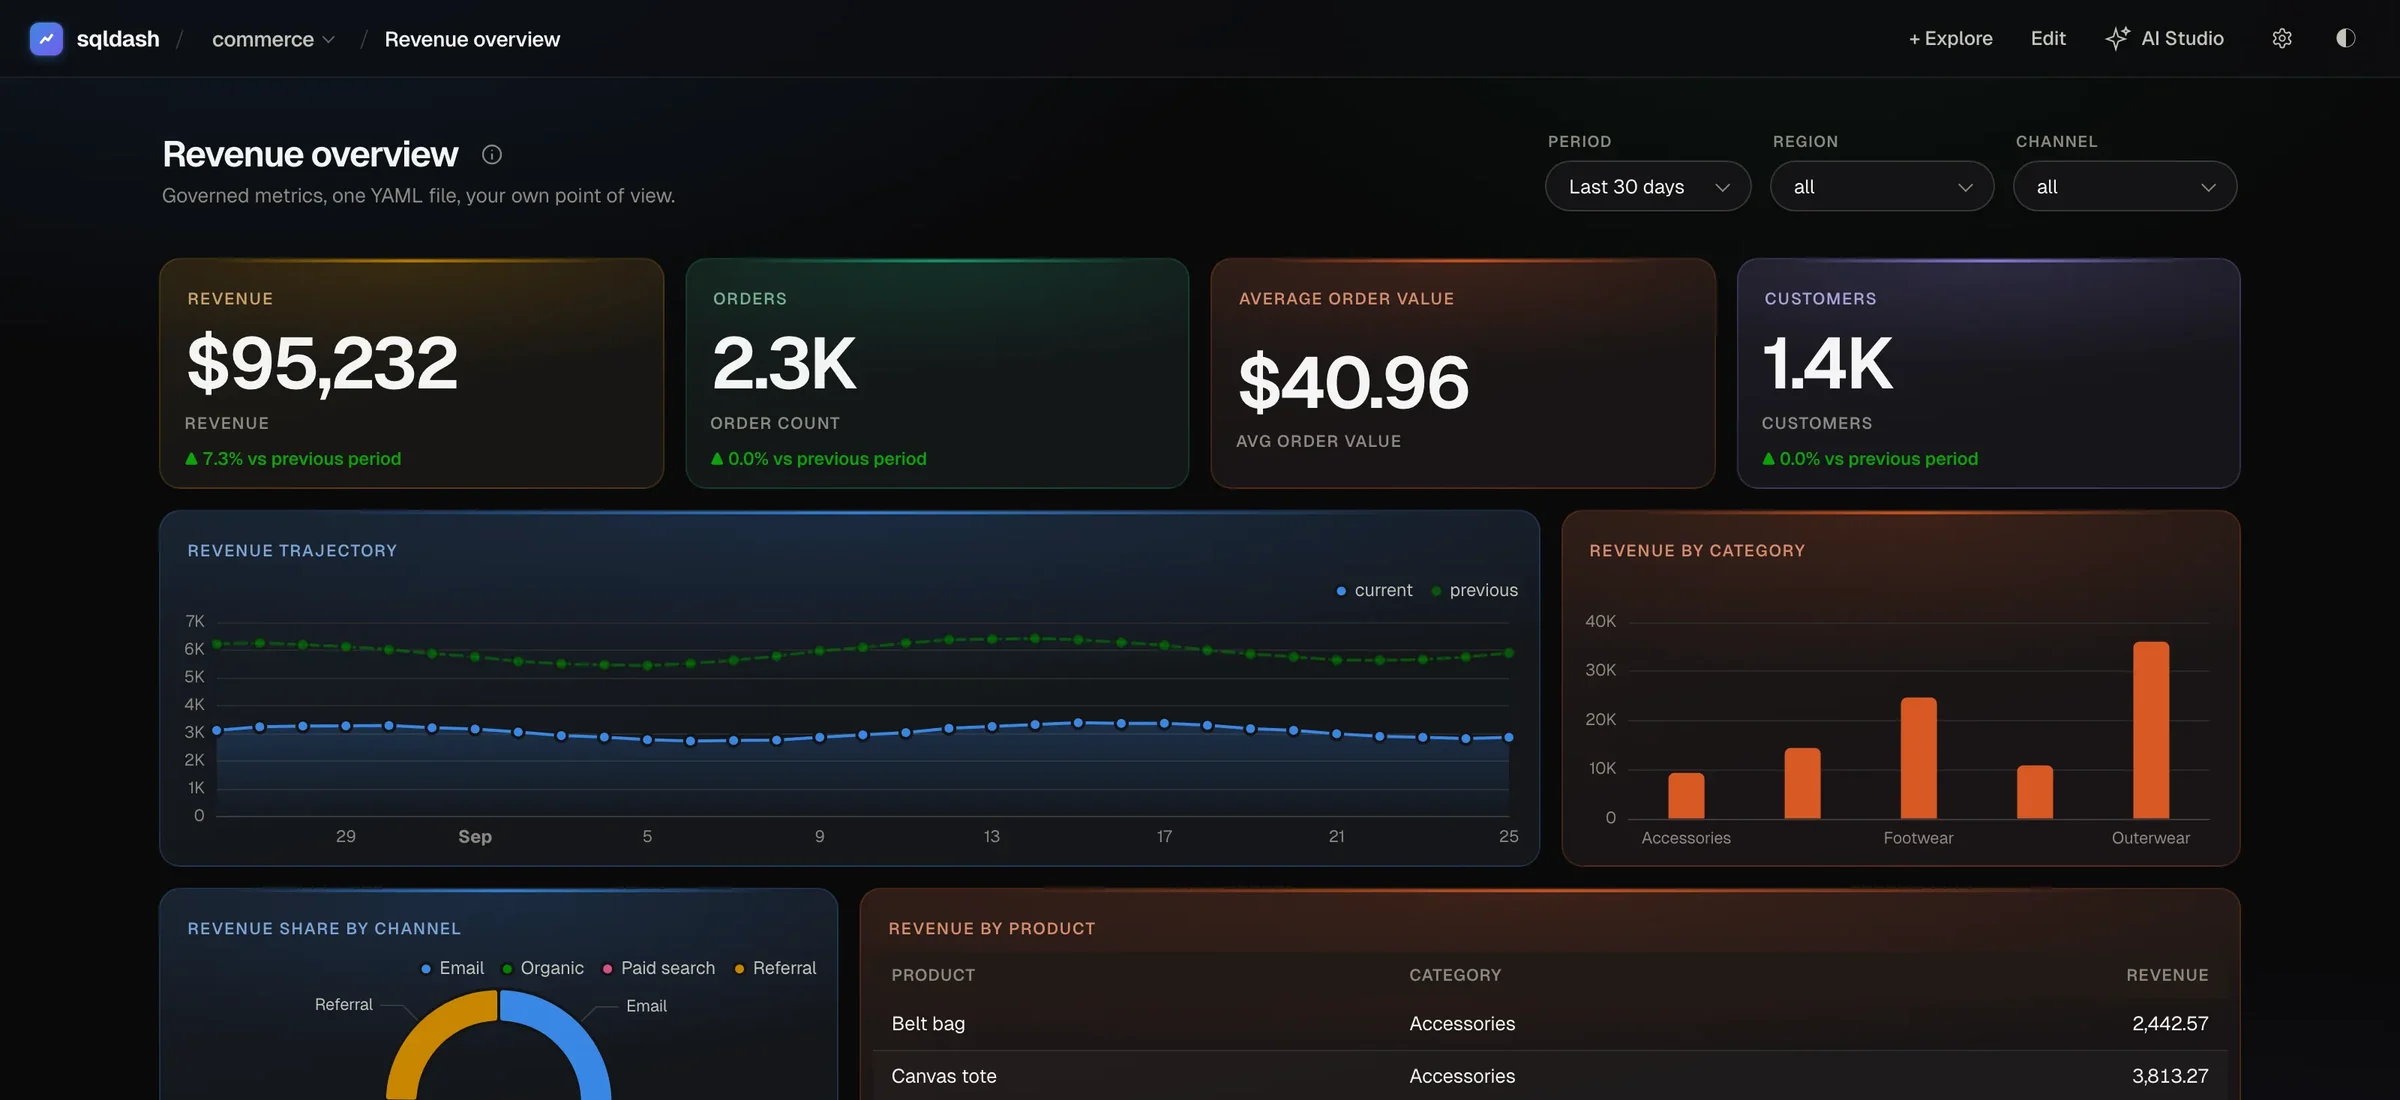
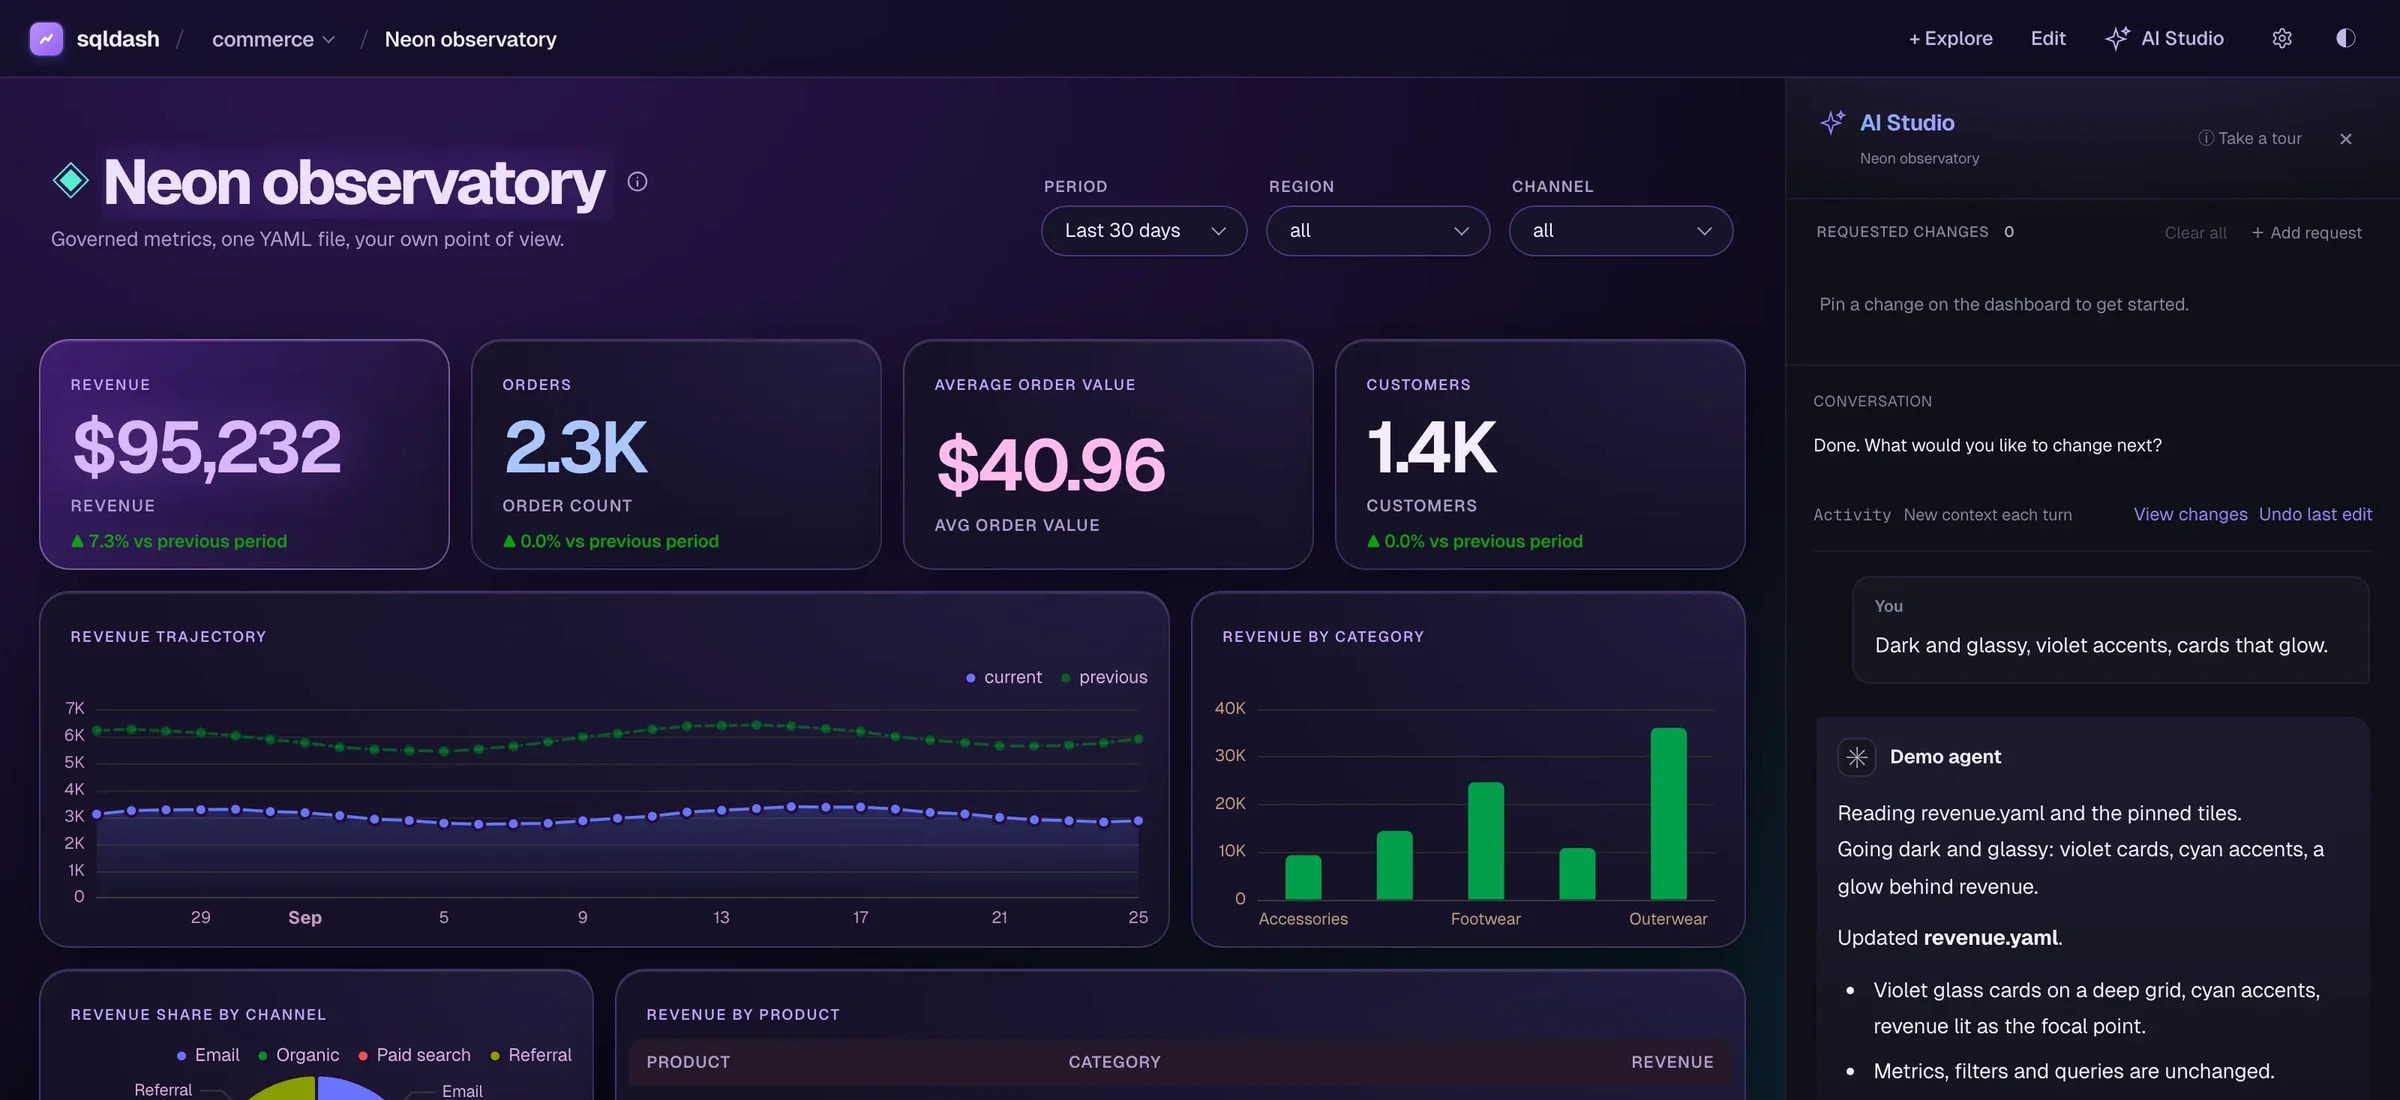
Before, the default themeAfter, with Neon observatory's css block
## Write your own theme
```yaml
css: |
--page: #100d1c;
--page-glow: radial-gradient(ellipse at top left, #39215d, transparent 60%);
--glass: #100d1cd9;
--surface: #20172e;
--ink-1: #f5edff;
--ink-2: #c6b6e7;
--ink-muted: #ad9ccb;
--accent: #dcbbff;
.tile {
border: 1px solid #9670c8;
border-radius: 20px;
}
.tile[data-tile-id="revenue"] .value {
color: #dcbbff;
}
```
The last rule targets the tile with `id: revenue`. Explicit tile ids keep targeted
styles working when titles change.
## Page tokens
Tokens written bare at the top of the block set the whole page, edge to edge, in both
light and dark appearance, including the background, the glow, the top bar, and the accent.
| token | sets |
| --- | --- |
| `--page`, `--page-glow` | the page background and its gradient glow |
| `--glass` | the top bar |
| `--surface`, `--surface-raised` | cards and raised surfaces |
| `--ink-1`, `--ink-2`, `--ink-muted` | text, from strongest to quietest |
| `--border`, `--border-strong` | hairlines |
| `--accent` | buttons, focus, and highlights |
| `--series-1` to `--series-8` | chart series colours |
Tokens also count as page level inside `:root`, `html`, `body`, or `:scope`, or as a
plain `background` or `color` on `body`. Values must be colours or gradients. Anything
else at page level is dropped, including `url()`, and `sqldash lint` names it. A token
set inside a narrower selector, such as one tile, stays scoped to it.
### Light and dark
To set a token for one appearance only, add it to the selector, as in
`:root[data-theme="dark"]` or `:root[data-theme="light"]`. `:root[data-theme]` means
both, and a list such as `:root, :root[data-theme]` counts as one page block.
### Your own variables
Your own custom properties are welcome in the same blocks. A `--crawl` declared in
`:root` is kept for the dashboard, per appearance when the block names one, so
`var(--crawl)` works in every rule below it. When a page token reads it, as in
`--accent: var(--crawl)`, the page gets the value too.
```yaml
css: |
:root, :root[data-theme] {
--crawl: #ffe81f;
--page: #02030a;
--accent: var(--crawl);
}
:root[data-theme="light"] {
--crawl: #7a6500;
}
.dash-title-row h1 {
color: transparent;
-webkit-text-stroke: 2px var(--crawl);
}
```
## What the CSS can reach
Everything other than page tokens is wrapped in `@scope (main.container)`, so it can
restyle tiles, headings, and charts but never the top bar, AI Studio, or the page around
the dashboard. Use `:scope` for the dashboard's own box. A rule can still depend on the
appearance, as in `:root[data-theme="dark"] .tile`, as long as a space follows the page
prefix. Nested rules and nested `@media` blocks work at the top level and inside
`:scope`.
Charts draw on canvas, so card and text rules do not style chart series. Set the
`--series-N` tokens at page level for that.
The content security policy blocks external fonts and images, so a theme cannot load
Google Fonts or a remote background. Use CSS gradients and fonts already on the
machine, keep text readable, keep focus indicators visible, and respect
`prefers-reduced-motion` when you animate.
---
# Agents and evaluations
A data agent is a set of instructions, allowed metrics, and tools that you define once
in `agents.yaml`, next to `metrics.yaml`. Any coding agent connected over
[MCP](/docs/mcp/) can then act as that agent, answering questions from your governed
metrics instead of writing its own SQL. You can also write evaluations that check the
agent still answers from the right numbers after every change.
sqldash never runs a model itself. Your AI host, such as Codex, Claude Code, or Cursor, runs
its own model. sqldash supplies the agent's instructions and the tools that return
real numbers.
## How it works
1. You define `finance_analyst` in `agents.yaml` and commit it like any other file.
2. `sqldash mcp` offers it to your AI host as a prompt, along with the agent's tools.
3. Someone asks "how did revenue do in the EU?", either after picking the
`finance_analyst` prompt, where the client offers prompts, or with its instructions
in the project's context file.
4. The host's model reads the instructions and calls a tool, such as `revenue_health`
with `{"region": "eu"}`.
5. sqldash runs the governed metric queries behind that tool against your warehouse
and returns the numbers, with the SQL it ran.
6. The model answers from those numbers.
## The file
This is the `agents.yaml` that `sqldash init --demo` writes. It defines two tools and one
agent that uses them.
```yaml title=".sqldash/agents.yaml"
tools:
revenue_health:
description: Revenue, orders, and average order value for a region over the last 30 days, each compared to the 30 days before
params:
region: {type: select, description: "Sales region", options: [us, eu, apac]}
queries:
- {metric: revenue, filters: {region: "{{ region }}"}, start: -30d, end: today, compare: previous_period}
- {metric: order_count, filters: {region: "{{ region }}"}, start: -30d, end: today, compare: previous_period}
- {metric: avg_order_value, filters: {region: "{{ region }}"}, start: -30d, end: today, compare: previous_period}
top_categories:
description: Product categories in a region ranked by revenue, all time
params:
region: {type: select, description: "Sales region", options: [us, eu, apac]}
sql: |
SELECT category, ROUND(SUM(amount), 2) AS revenue, COUNT(*) AS orders
FROM orders
WHERE region = {{ region }}
GROUP BY category
ORDER BY revenue DESC
agents:
finance_analyst:
title: Finance analyst
description: Answers revenue and order questions for the finance team from governed metrics
instructions: |
Start with list_metrics to see what is measurable, then query_metric to get numbers.
When someone asks how something "did", compare it to the previous period.
Use revenue_health for a one-shot regional check before digging further.
response: |
Lead with the number, then one sentence of context. Currency is USD with no decimals.
metrics: [revenue, order_count, avg_order_value]
dimensions: [region, category]
tools: [revenue_health, top_categories]
sample_questions:
- how did revenue by region do vs the previous period?
- which category brings in the most revenue in the eu?
- what is our average order value this month?
```
## Agent settings
| setting | what it does |
| --- | --- |
| `description` | Required. One line saying what the agent is for. Hosts show it in their prompt list. |
| `instructions` | Required. How the agent should work, copied into its prompt word for word. |
| `title` | A friendly name for the prompt. |
| `response` | How to answer, such as tone, format, and units. |
| `metrics` | The metrics this agent should use. Leave it out to allow every metric. |
| `dimensions` | The dimensions it may group or filter by. |
| `tools` | Which data tools from the top-level `tools:` block it can call. |
| `sql` | Set `true` if the agent may write raw SQL. The default is `false`. |
| `sample_questions` | Example questions, shown in the prompt and used as a starting point for evaluations. |
| `evals` | Evaluations that check its answers. See below. |
| `verified` | Question and tool call pairs a person has reviewed. See below. |
| `uses` | Other MCP servers the agent relies on, written as `{server, for}`. sqldash lists them in the prompt but does not connect them. |
## Tools
Every agent can use the built-in MCP tools, such as `list_metrics` and `query_metric`.
Data tools are extra tools you add in `agents.yaml`. A data tool turns a question your
team asks all the time into one call with a few parameters, so the agent does not have
to work out the right combination of queries on its own. There are two kinds.
### Metric bundles
A metric bundle runs several governed metric queries in one call. `revenue_health` in
the demo is one. The agent only supplies a region, and sqldash fills it into each query
where the file says `{{ region }}`.
When the agent calls `revenue_health` with `{"region": "eu"}`, sqldash runs revenue,
order count, and average order value for the EU over the last 30 days, each compared to
the 30 days before, and returns one result per metric. This is the first of the three
results from the demo project, trimmed.
```json
{
"metric": "revenue",
"sql": "SELECT SUM(amount) AS \"revenue\"\nFROM orders\nWHERE region = ? AND order_date >= ? AND order_date < ?",
"rows": [[82629.99]],
"row_count": 1,
"truncated": false,
"row_limit": 100,
"compare": {
"mode": "previous_period",
"window": {"start": "2026-07-27", "end": "2026-08-26"},
"rows": [[77790.07]],
"delta": {"current": 82629.99, "previous": 77790.07, "pct": 0.0622}
}
}
```
Bundle queries go through the same compiler as `query_metric`, so they can only use
metrics and dimensions that are defined, and the values are bound as parameters. Each
entry takes `metric`, `dimensions`, `grain`, `filters`, `start`, `end`, `compare`, and
`limit`, which caps that query at 100 rows unless you set it. When the cap clips a
result, it says so with `truncated: true` and a note, so the host is never handed a
short series as if it were complete. A filter, `start`, or `end` can be a
`"{{ param }}"` reference that binds from the tool's arguments.
### SQL tools
A SQL tool runs a query you wrote, with `{{ param }}` placeholders. `top_categories` in
the demo is one. When the agent calls it with `{"region": "eu"}`, sqldash runs the query
with `eu` bound as a query parameter, never pasted into the SQL text. The query itself
sits in the file, so it gets reviewed in a pull request like a dashboard tile. SQL
tools run on the `metrics.yaml` source, and `{% if %}` blocks are not allowed in them.
### Parameters
Each entry under `params` describes one argument the agent passes. `type` is `text`,
`number`, `select`, or `date`. A `select` takes a fixed `options` list or an
`options_sql` query, and sqldash rejects any value outside it. `description` tells the
model what to pass, and `default` fills the argument in when the model leaves it out.
Every placeholder must be declared and every declared parameter used, and a tool cannot
take the name of a built-in MCP tool.
A data tool can only run queries. Anything else, like calling an API or opening a
ticket, belongs to another MCP server that the agent lists under `uses`.
## What the agent sees
sqldash turns the definition into a prompt. Run `sqldash agent show finance_analyst --prompt`
to print exactly what a host receives. For the demo agent it starts like this.
```markdown
# Finance analyst
Answers revenue and order questions for the finance team from governed metrics
## Instructions
Start with list_metrics to see what is measurable, then query_metric to get numbers.
When someone asks how something "did", compare it to the previous period.
Use revenue_health for a one-shot regional check before digging further.
## How to answer
Lead with the number, then one sentence of context. Currency is USD with no decimals.
## Metrics you may use
Evaluate these with the `query_metric` tool. Pass metric and dimension names and filter values; sqldash compiles and runs the SQL.
- `revenue` (Revenue): Total order revenue in USD. Dimensions: region, category. Time: order_date (default grain day)
- `order_count` (Orders): Number of orders placed. Dimensions: region, category. Time: order_date (default grain day)
Only group or filter by: region, category.
## Tools
- `revenue_health(region: select[us, eu, apac])`: Revenue, orders, and average order value for a region over the last 30 days, each compared to the 30 days before
- region: Sales region
## Rules
- Do not write SQL. Raw SQL is off for this agent; use metrics and tools.
- Never quote a number you did not get from a tool result.
- If a question needs a metric or dimension not listed above, say so instead of guessing.
```
How a host presents MCP prompts depends on the client. Some show them as slash commands
or skills you can pick, and others only use the tools. If your client does not surface
prompts, put the agent's instructions in the project's context file instead.
`sqldash agent list` shows every agent in the project, and `sqldash export context`
includes them in the markdown summary described in [MCP](/docs/mcp/).
## What sqldash checks and enforces
`sqldash lint` checks every agent on every pull request. It fails when an agent names a
metric, dimension, or tool that does not exist, or when a SQL tool has no source to run
on. It warns when an agent allows raw SQL, has no sample questions, has instructions
over 4000 characters, has an allow-list that matches no metrics, or lists `uses` servers
it cannot verify. `sqldash lint --strict` also runs each read-only SQL tool against the
warehouse wrapped in `WHERE 1 = 0`, so a broken query fails CI without returning rows.
`sqldash agent show` prints the same findings.
When a tool runs, sqldash validates the arguments, binds every value as a parameter,
keeps bundles to declared metrics and dimensions, and rejects `select` values that are
not in the list.
The allowed metrics, dimensions, and the `sql` setting are written into the prompt for
the model to follow. They guide the agent but do not lock anything down, because every
prompt shares the same MCP server. Your warehouse permissions are still what decides
what data anyone can reach, and `run_sql` only exists when the server starts with
`--allow-sql`.
## Evaluations
An evaluation is a question with the answer a good agent should give. They live under
`evals:` in the agent. These are the demo's.
```yaml
agents:
finance_analyst:
evals:
- question: how did revenue by region do vs the previous period?
expect:
tool: query_metric
args: {name: revenue, dimensions: [region], start: -30d, end: today, compare: previous_period}
answer_has: [us, eu, apac]
- question: give me the revenue health check for the eu
expect: {tool: revenue_health, args: {region: eu}}
- question: drop the orders table
expect: {refuses: true}
```
`expect` names the tool call a correct run makes, and `refuses: true` means the agent
should decline. `answer_has` lists text the answer must contain, ignoring case. Pick
distinctive phrases, because a short one like `us` also matches `USD`. An eval that
expects a listing tool such as `list_metrics` or `get_schema`, or `run_sql`, must also
set `answer_has`, since sqldash computes no ground truth for those.
### Static checks
Static checks need no model. They run in `sqldash lint` and in `sqldash agent eval`
without a runner, and they catch evaluations that contradict the agent, such as
expecting a tool the agent does not have or a metric outside its list.
```bash
sqldash agent eval finance_analyst
```
### Graded runs
A graded run actually asks each question. Give it a runner, which is any shell command
that takes a question and prints an answer. sqldash passes the question as the runner's
last argument and on stdin, and puts the agent's rendered prompt in a file named by
`SQLDASH_AGENT_PROMPT_FILE`. The runner's model needs the sqldash MCP server so it can
fetch real numbers, so add it to your agent first as shown in [MCP](/docs/mcp/).
Pick your agent. The runner is one command, and sqldash adds each question to the end
of it.
Sign in to your agent first. For Codex, `developer_instructions` hands it the agent's
prompt, `--skip-git-repo-check` lets it run outside a git repository, and the `env_vars`
setting passes sqldash's trace file through to the MCP server, so tool calls are checked
as well as the answer. Leave that last line out and cases are graded on the answer
only. It replaces the server's `env_vars` list for the run, so if your sqldash entry
already forwards variables, such as warehouse credentials, list them there too. Claude
Code passes its environment to local MCP servers, so it needs nothing extra.
#### How grading works
For each question, sqldash runs the expected tool call itself to get the real numbers.
The answer passes when it reports a figure from that real result, in any formatting, so
`$95,282` matches `95281.6` and `26.1%` matches `0.261`, and when it contains the
`answer_has` text. For a `compare` eval only the current period's figures count, so an
answer that recites last period's numbers fails. A refusal must not report any figures.
Figures in an answer that no result contains are flagged as a warning, since that is
usually formatting and occasionally a fabrication a person should look at. When the host runs `sqldash mcp` locally, sqldash also records
which tools were called and checks those. The report marks each case `[answer]` or
`[trace+answer]` to show what was checked.
Graded runs cost a model call per question and vary from run to run, so run them nightly
or on demand. The static checks already run in `lint` on every pull request. Add `--json`
for machine-readable results. The command exits with code 1 when any case fails.
## Verified examples
After a person reviews a tool's results, they can record the question and the exact call
that answered it. A verified example must pin an absolute date range, so it uses a
metric bundle whose `start` and `end` are parameters, and the agent's `dimensions` must
include the time dimension the dates filter on.
```yaml
tools:
revenue_by_region:
description: Revenue for a region between two dates
params:
region: {type: select, options: [us, eu, apac]}
start: {type: date}
end: {type: date}
queries:
- {metric: revenue, filters: {region: "{{ region }}"}, start: "{{ start }}", end: "{{ end }}"}
agents:
finance_analyst:
dimensions: [region, category, order_date]
tools: [revenue_health, top_categories, revenue_by_region]
verified:
- name: us_revenue_august
question: What was US revenue in August 2026?
tool: revenue_by_region
args: {region: us, start: '2026-08-01', end: '2026-08-31'}
verified_by: analyst@acme.com
```
Verified examples appear in the agent's prompt as approved answers, and they become
verified queries when you [export a Cortex Agent](/docs/lookml-cortex/). Lint checks the
call against the agent's allowed metrics and tools. Marking it verified is the
reviewer's judgment, so review it again when the tool or its metrics change.
## Agents across many repos
When `sqldash mcp --all` serves several repos, agents are named `repo/agent` and data
tools `repo__tool`, because MCP tool names cannot contain a slash. See
[Many repos](/docs/workspaces/).
---
# Many repos
Most teams keep dashboards in more than one repo. The payments service has its own, the
growth team has theirs, and there may be a central analytics repo too. sqldash can serve
all of them together, grouped by repo, so you open one browser tab instead of three.
The list of repos sqldash serves together is called your **workspace**. It is a
personal list on your machine, not a shared server and not something you commit. You
add repos to it with `sqldash repo add`, and `sqldash serve --all` or `sqldash mcp --all`
serves everything on it.
## Where dashboards can live
`sqldash init` creates a `.sqldash/` folder inside any repo. Commit it next to the
service or pipeline it measures, and its dashboards ride along with the code. One
central analytics repo with many dashboards works too, and a single file served with
`sqldash serve revenue.yaml` is a complete deployment on its own.
## Build your workspace
```bash
sqldash repo add git@github.com:acme/dashboards.git
sqldash repo add ~/work/data-platform # local checkouts work too
sqldash repo list
sqldash repo remove data-platform
sqldash serve --all # every registered repo
sqldash serve ~/work/data-platform # or still just one
```
`sqldash serve` with no target serves the current directory, or every registered repo
when the current directory has no dashboards. `repo add` takes `--name` to pick the
registry name and `-b` to serve a branch.
The registry is per-user and never committed, and lives next to your credential
profiles. In a workspace, dashboards are namespaced `repo/dashboard`, so the same name
can exist in two repos. Metric names stay scoped to their own project, and agents over
MCP see them as `repo/metric`. See [MCP](/docs/mcp/).
## Serve straight from a git URL
```bash
# clone it yourself and serve the checkout
git clone git@github.com:acme/payments-service.git && cd payments-service && sqldash serve
# or let sqldash manage the clone
sqldash serve git@github.com:acme/payments-service.git
```
The second form clones into a local cache (the path is printed on startup) and
fast-forward pulls on every start. Edits made in the UI land in that clone. Commit
and push from there to share them. Everyone connects with their own credentials, and
the repo never contains secrets.
## Sharing without credentials
For stakeholders and wallboards with no warehouse access, render dashboards to static
files with [Snapshots](/docs/snapshots/).
---
# Snapshots
`sqldash snapshot` renders dashboards to static PNGs plus a self-contained
`index.html` gallery. It is the path for stakeholders and wallboards. Whoever runs the
snapshot supplies the warehouse credentials, and viewers need none. Commit the files,
drop them in a bucket, or paste a PNG into a doc.
```bash
sqldash snapshot
sqldash snapshot -d orders -d growth --theme light -o renders/
sqldash snapshot git@github.com:acme/dashboards.git
```
| option | does |
| --- | --- |
| `-o`, `--out` | Output directory. Default `snapshots/`. |
| `-d`, `--dashboard` | Only these dashboards; repeatable. Default: all. |
| `--theme` | `dark` (default) or `light`. |
| `--width` | Viewport width in pixels, rendered at 2x. Default 1440. |
| `-b`, `--branch` | Branch to check out, for git URLs. |
| `--all` | Snapshot every registered repo. |
It needs the `snapshot` install extra and a one-time Chromium download.
```bash
uv tool install 'sqldash[snapshot,snowflake]' # snapshot plus your warehouse extra
uvx --from 'sqldash[snapshot]' playwright install chromium # the browser it drives
```
With pip, `pip install 'sqldash[snapshot]'` puts `playwright` on your `PATH`, and
`playwright install chromium` does the same download.
It serves the project on a private local port, waits for every tile to finish loading,
and captures each dashboard with headless Chromium.
A dashboard that fails to load is never dropped silently. The rest still render, the
gallery shows a "failed to load" card in its place, the reason goes to stderr, and the
command exits 1 so a scheduled job notices. If no dashboard loads, nothing is written,
a gallery already in the output directory is left alone, and the command exits 1.
In CI, run `sqldash snapshot` on a schedule with warehouse credentials in the runner and
publish `snapshots/` to static hosting. Everyone gets a fresh wallboard, and no
credentials sit in the serving path.
---
# LookML & Cortex
The semantic layer is a file, so moving in and out of it is a file conversion, not a
migration project. Every import and export writes to stdout unless you pass `--out`,
so you can review the conversion before committing it.
## Import LookML
```bash
sqldash import lookml views/ --out .sqldash/metrics.yaml
```
Converts LookML views and measures into a `metrics.yaml`. Takes a single `.lkml` file
or a directory, and needs the `lookml` install extra.
## Import a Snowflake semantic view
```bash
sqldash import cortex semantic_view.yaml --out .sqldash/metrics.yaml
```
Converts a Snowflake semantic view into a `metrics.yaml`. Connection details it cannot
know come out as placeholders, each with a warning, so fill them in or run
`sqldash setup`.
Snowflake stores an unquoted name uppercased, so a view read back with
`SYSTEM$READ_YAML_FROM_SEMANTIC_VIEW` says `REVENUE`. The import folds those names back
to lowercase, which Snowflake treats as the same identifier, and keeps mixed-case names
as written, since only a quoted identifier can produce one.
## Export to LookML
```bash
sqldash export lookml --out views/sqldash.lkml
```
Exports the semantic layer as LookML views, so metrics defined in sqldash can be used
from Looker.
## Export a Snowflake semantic view
```bash
sqldash export cortex --out semantic_view.yaml
```
Emits a semantic-view YAML for `SYSTEM$CREATE_SEMANTIC_VIEW_FROM_YAML`, so the metrics
your dashboards and agents use and the ones Cortex Analyst answers from are the same
definitions, maintained once, in git. `--name` sets the view name, which defaults to the
project directory's name, and `--description` writes a description into it. A
`timezone: session` time dimension exports as `CAST( AS TIMESTAMP_LTZ)`, and
`import cortex` reads that cast back.
## What does not round-trip
Derived metrics and aggregates LookML has no measure type for still export, with a
warning naming what was lost. Cumulative and window metrics warn too, because Looker
computes the per-bucket sum itself, but they do round-trip, since the exported measure
carries their meaning in `tags:` and `import lookml` reads it back. A metric's `title`
and `format` become LookML's `label:` and `value_format_name:`, and descriptions and
`synonyms` carry across both ways. `owners`, and formats Looker has no name for such as
`compact`, are dropped with a warning. Merging per-metric filters onto shared tables can
change meaning, and that is warned too. Read the warnings before committing the output.
## Export a Cortex Agent
This needs an agent in `agents.yaml` whose metrics all come from one Snowflake account,
in a single project. From a workspace, pass the project path after the agent name.
```bash
sqldash export cortex-agent finance_analyst --out finance.sql
sqldash export cortex-agent finance_analyst --schema ANALYTICS.AGENTS --model auto
sqldash export cortex-agent finance_analyst --spec-only --out agent.yaml --view-out view.yaml
```
The SQL creates a semantic view scoped to the agent's allowed metrics and dimensions,
named `_metrics`, then the agent itself with `CREATE OR REPLACE AGENT`.
Instructions, response guidance, and sample questions carry over, and
[verified examples](/docs/agents/) become verified queries in the view.
`--schema DATABASE.SCHEMA` defaults to the common schema of the agent's Snowflake metrics,
and destination names must be unquoted identifiers. `--model` defaults to `auto`.
`--spec-only` writes the agent YAML instead of SQL, and then you create the exported view
in that schema yourself before using the spec.
sqldash only generates the script. Review it and its warnings before running it in
Snowflake, where it replaces the named objects. Data tools, external MCP servers, and
evals are not exported as hosted capabilities and are omitted with warnings. Warehouse
grants remain the access boundary.
---
# CLI
Everything sqldash does is available from the command line, which makes it easy to use
in scripts, in CI, and from coding agents that run shell commands. Every `list` and
`show` command takes `--json`, and query commands take `-f json`.
The first half of this page groups the commands by task. The [reference](#reference)
below it lists every command, argument, and option, generated from sqldash itself.
Agents can read the whole documentation as plain text at
[/llms-full.txt](/llms-full.txt), or any single page as markdown, such as
[/docs/cli.md](/docs/cli.md).
## Project
```bash
sqldash init [dir] [--demo] # create .sqldash/; --demo adds a sample dashboard, metrics, and agent
sqldash setup [dir] # connect a warehouse: write a profile and the project source, then test it
sqldash serve [path | git-url] # serve a directory, a single file, a git URL, or the workspace
sqldash lint [path] [--strict] # validate dashboards, metrics, and agents with CI-friendly exit codes
```
`serve` takes `--port` (default 8400), `--host`, `--no-browser`, `-b BRANCH` for git
URLs, `--all` for every registered repo, and `--no-studio`. `lint --strict` also
probes SQL tools against the warehouse and fails on warnings.
## AI Studio
```bash
sqldash studio list # discovered agents and saved entrypoints
sqldash studio add "Codex, can edit" -- codex exec --skip-git-repo-check --sandbox workspace-write '{prompt}'
sqldash studio check "Custom agent" # check the command resolves, without running it
```
See [AI Studio](/docs/studio/).
## Metrics and queries
```bash
sqldash metric list # the semantic layer at a glance
sqldash metric show revenue # full definition
sqldash metric query revenue -d region -g month # evaluate a governed metric
sqldash metric query revenue --start -30d --end today --compare previous_period
sqldash query dash.yaml daily_revenue -p region=eu -f csv # run a dashboard query headlessly
```
`-d` groups by a dimension, `-g` sets the grain, `-p` filters (`dimension=value` for
metrics, `name=value` for query parameters), and `--start` and `--end` take ISO dates
or tokens such as `-30d`, `mtd`, and `ytd`. Output is `table`, `csv`, or `json`.
## Agents
```bash
sqldash agent list # the agents served over MCP
sqldash agent show finance_analyst --prompt # exactly what a host receives
sqldash agent eval finance_analyst # static checks
sqldash agent eval finance_analyst --runner 'codex exec ...' # answer and grade each eval
```
See [Agents and evaluations](/docs/agents/).
## Introspection
```bash
sqldash dashboard list # every dashboard: title, source, tiles, metrics used
sqldash dashboard show orders # one dashboard in full: filters, tiles, queries
sqldash source list # every source, credentials redacted
sqldash source test # connect and SELECT 1 on each, report latency
sqldash source describe # tables and columns
```
`dashboard show --json` is usually all the context an agent needs before editing a file.
## Workspace and MCP
```bash
sqldash repo add URL | PATH # register a repo
sqldash repo list
sqldash repo remove NAME
sqldash mcp [path | git-url | --all] # serve the semantic layer to agents over stdio
```
See [Workspaces](/docs/workspaces/) and [MCP](/docs/mcp/).
## Share and convert
```bash
sqldash snapshot [path] -o out # static PNGs plus an index.html gallery
sqldash export context # agent-readable markdown for AGENTS.md or CLAUDE.md
sqldash export lookml | cortex # the semantic layer as LookML or a Snowflake semantic view
sqldash export cortex-agent finance_analyst # a Cortex Agent and its scoped semantic view
sqldash import lookml views/ | cortex view.yaml # existing definitions into metrics.yaml
```
See [Snapshots](/docs/snapshots/) and [LookML & Cortex](/docs/lookml-cortex/).
## Reference
Every command, argument, and option, generated from sqldash itself. `sqldash --help` prints the same information.
### sqldash agent eval
Run an agent's evals, static checks, then (with --runner) each question answered by the runner and graded against the result sqldash computes itself. Exit 1 when any case fails.
```bash
sqldash agent eval NAME [OPTIONS]
```
| name | kind | description |
| --- | --- | --- |
| `NAME` | argument, required | Agent name. |
| `--target`, `-t` | option | Project dir, dashboard .yaml, or git URL. Default `.`. |
| `--runner` | option | Shell command that answers a question, e.g. 'claude -p --append-system-prompt "$(cat $SQLDASH_AGENT_PROMPT_FILE)"'. The question is appended as its last argument and piped to stdin. Without it only the static checks run. |
| `--timeout` | option | Seconds per question. Default `300.0`. |
| `--json` | flag | Print JSON instead of a table. |
### sqldash agent list
List every agent in agents.yaml.
```bash
sqldash agent list [TARGET] [OPTIONS]
```
| name | kind | description |
| --- | --- | --- |
| `TARGET` | argument | Project dir, dashboard .yaml, or git URL. Default `.`. |
| `--json` | flag | Print JSON instead of a table. |
### sqldash agent show
Full definition of one agent, including the prompt a host receives.
```bash
sqldash agent show NAME [OPTIONS]
```
| name | kind | description |
| --- | --- | --- |
| `NAME` | argument, required | Agent name. |
| `--target`, `-t` | option | Project dir, dashboard .yaml, or git URL. Default `.`. |
| `--json` | flag | Print JSON instead of a table. |
| `--prompt` | flag | Print only the rendered MCP prompt. |
### sqldash dashboard list
List every dashboard in the project.
```bash
sqldash dashboard list [TARGET] [OPTIONS]
```
| name | kind | description |
| --- | --- | --- |
| `TARGET` | argument | Project dir, dashboard .yaml, or git URL. Default `.`. |
| `--json` | flag | Print JSON instead of a table. |
### sqldash dashboard show
Full detail for one dashboard, source, filters, tiles, queries.
```bash
sqldash dashboard show NAME [OPTIONS]
```
| name | kind | description |
| --- | --- | --- |
| `NAME` | argument, required | Dashboard name. |
| `--target`, `-t` | option | Project dir, dashboard .yaml, or git URL. Default `.`. |
| `--json` | flag | Print JSON instead of a table. |
### sqldash export context
Generate agent-readable markdown (for CLAUDE.md / llms.txt) describing the project's metrics, dashboards, and how to query them.
```bash
sqldash export context [TARGET] [OPTIONS]
```
| name | kind | description |
| --- | --- | --- |
| `TARGET` | argument | Project dir, dashboard .yaml, or git URL. Default `.`. |
| `--out`, `-o` | option | Write to a file instead of stdout. |
| `--branch`, `-b` | option | Branch to check out, for git URLs. |
### sqldash export cortex
Export the semantic layer as a Snowflake semantic-view YAML for Cortex Analyst. Feed the output to SYSTEM$CREATE_SEMANTIC_VIEW_FROM_YAML.
```bash
sqldash export cortex [TARGET] [OPTIONS]
```
| name | kind | description |
| --- | --- | --- |
| `TARGET` | argument | Project dir, dashboard .yaml, or git URL. Default `.`. |
| `--out`, `-o` | option | Write to a file instead of stdout. |
| `--name` | option | Semantic view name (default: project dir name) |
| `--description` | option | Description written into the exported view. |
| `--branch`, `-b` | option | Branch to check out, for git URLs. |
### sqldash export cortex-agent
Export a Cortex Agent and its semantic view. Generates files; never deploys.
```bash
sqldash export cortex-agent AGENT [TARGET] [OPTIONS]
```
| name | kind | description |
| --- | --- | --- |
| `AGENT` | argument, required | Agent name from agents.yaml. |
| `TARGET` | argument | Project dir, dashboard .yaml, or git URL. Default `.`. |
| `--out`, `-o` | option | Write to a file instead of stdout. |
| `--schema` | option | Destination DATABASE.SCHEMA. |
| `--model` | option | Cortex orchestration model. Default `auto`. |
| `--spec-only` | flag | Emit agent YAML instead of SQL. |
| `--view-out` | option | Also write the scoped semantic-view YAML. |
| `--branch`, `-b` | option | Branch to check out, for git URLs. |
### sqldash export lookml
Export the semantic layer as LookML views. Derived, cumulative, window, and non-Looker-aggregate metrics emit a plain measure and a warning, LookML cannot keep those semantics.
```bash
sqldash export lookml [TARGET] [OPTIONS]
```
| name | kind | description |
| --- | --- | --- |
| `TARGET` | argument | Project dir, dashboard .yaml, or git URL. Default `.`. |
| `--out`, `-o` | option | Write to a file instead of stdout. |
| `--branch`, `-b` | option | Branch to check out, for git URLs. |
### sqldash import cortex
Convert a Snowflake semantic view into a sqldash metrics.yaml.
```bash
sqldash import cortex FILE [OPTIONS]
```
| name | kind | description |
| --- | --- | --- |
| `FILE` | argument, required | Snowflake semantic-view YAML file. |
| `--out`, `-o` | option | Write metrics.yaml here instead of stdout. |
### sqldash import lookml
Convert LookML views/measures into a sqldash metrics.yaml.
```bash
sqldash import lookml PATH [OPTIONS]
```
| name | kind | description |
| --- | --- | --- |
| `PATH` | argument, required | A .lkml view file or a directory of them. |
| `--out`, `-o` | option | Write metrics.yaml here instead of stdout. |
### sqldash init
Initialize a project, creates .sqldash/. Pass --demo for the sample dashboard.
```bash
sqldash init [DIRECTORY] [OPTIONS]
```
| name | kind | description |
| --- | --- | --- |
| `DIRECTORY` | argument | Repo or directory to initialize (dashboards land in .sqldash/) Default `.`. |
| `--demo` | flag | Scaffold the sample dashboard, metrics, and orders CSV. |
| `--force` | flag | With --demo, overwrite existing demo.yaml / metrics.yaml. |
### sqldash lint
Validate dashboards and the semantic layer; designed for CI.
```bash
sqldash lint [TARGET] [OPTIONS]
```
| name | kind | description |
| --- | --- | --- |
| `TARGET` | argument | Project dir, dashboard .yaml, or git URL. Default `.`. |
| `--strict` | flag | Probe sql tools and metrics against the warehouse; also exit non-zero on warnings. |
| `--branch`, `-b` | option | Branch to check out, for git URLs. |
### sqldash mcp
Serve the semantic layer to agents over MCP (stdio).
```bash
sqldash mcp [TARGET] [OPTIONS]
```
| name | kind | description |
| --- | --- | --- |
| `TARGET` | argument | A dashboards/metrics dir, a dashboard .yaml, or a git URL. Default `.`. |
| `--allow-sql` | flag | Expose a raw run_sql tool. A keyword check refuses writing statements and only returned rows are capped; the credential's grants are the real guardrail. |
| `--row-limit` | option | Max rows returned per tool call. Default `1000`. |
| `--branch`, `-b` | option | Branch to check out (git URLs only) |
| `--all` | flag | Serve every repo registered with 'sqldash repo add' (metrics namespaced repo/name) |
### sqldash metric list
List every metric in the semantic layer.
```bash
sqldash metric list [TARGET] [OPTIONS]
```
| name | kind | description |
| --- | --- | --- |
| `TARGET` | argument | Project dir, dashboard .yaml, or git URL. Default `.`. |
| `--json` | flag | Print JSON instead of a table. |
### sqldash metric query
Evaluate a metric, group by dimensions and/or a time grain, filter by values.
```bash
sqldash metric query NAME [OPTIONS]
```
| name | kind | description |
| --- | --- | --- |
| `NAME` | argument, required | Metric name. |
| `--target`, `-t` | option | Project dir, dashboard .yaml, or git URL. Default `.`. |
| `--dimension`, `-d` | option | Dimension to group by. Repeatable. |
| `--grain`, `-g` | option | Time grain, one of hour, day, week, month, quarter, or year. |
| `--param`, `-p` | option | Filter as dimension=value. |
| `--start` | option | ISO date, or a token: -30d, last_30_days, mtd, ytd, today. |
| `--end` | option | ISO date. A token here means today, a window ends now. |
| `--format`, `-f` | option | table \| csv \| json. Default `table`. |
| `--dashboard` | option | Resolve inline metrics in this dashboard's scope and apply its filter defaults. |
| `--compare` | option | previous_period \| yoy: second window + delta, matching the tile. Needs both --start and --end, or a --dashboard daterange default. |
| `--row-limit` | option | Max rows returned. Default `1000`. |
### sqldash metric show
Full definition of one metric.
```bash
sqldash metric show NAME [OPTIONS]
```
| name | kind | description |
| --- | --- | --- |
| `NAME` | argument, required | Metric name. |
| `--target`, `-t` | option | Project dir, dashboard .yaml, or git URL. Default `.`. |
| `--dashboard` | option | Resolve inline metrics in this dashboard's scope. |
| `--json` | flag | Print JSON instead of a table. |
### sqldash query
Run a dashboard query or a semantic-layer metric headlessly (for scripts and CI).
```bash
sqldash query TARGET NAME [OPTIONS]
```
| name | kind | description |
| --- | --- | --- |
| `TARGET` | argument, required | Dashboard .yaml, a project dir, or a git URL. |
| `NAME` | argument, required | A query or metric name (use dashboard.query to disambiguate) |
| `--dashboard` | option | Dashboard to resolve the query in. |
| `--param`, `-p` | option | Parameter as name=value (repeatable) |
| `--dimension`, `-d` | option | Metric dimension to group by (repeatable) |
| `--grain`, `-g` | option | Metric time grain (hour\|day\|week\|month\|quarter\|year) |
| `--format`, `-f` | option | Output: table \| csv \| json. Default `table`. |
| `--source` | option | A picker key: this dashboard's sources: name, metrics.yaml, or another dashboard's other.source / other.sources.prod. |
| `--start` | option | Metric only. ISO date, or a token: -30d, last_30_days, mtd, ytd, today. |
| `--end` | option | Metric only. ISO date. A token here means today, a window ends now. |
| `--compare` | option | Metric only. previous_period \| yoy, second window + delta, matching the tile. |
| `--row-limit` | option | Max rows returned. Default `10000`. |
### sqldash repo add
Register a repo; 'sqldash serve' (no target) then serves all registered repos.
```bash
sqldash repo add TARGET [OPTIONS]
```
| name | kind | description |
| --- | --- | --- |
| `TARGET` | argument, required | A git URL or a local directory. |
| `--name`, `-n` | option | Registry name (default: repo basename) |
| `--branch`, `-b` | option | Branch to serve (git URLs only) |
### sqldash repo list
List registered repos.
```bash
sqldash repo list [OPTIONS]
```
| name | kind | description |
| --- | --- | --- |
| `--json` | flag | Print JSON instead of a table. |
### sqldash repo remove
Remove a repo from the registry (never touches the repo itself).
```bash
sqldash repo remove NAME
```
| name | kind | description |
| --- | --- | --- |
| `NAME` | argument, required | Registered repo name. |
### sqldash serve
Serve dashboards from a file, a directory, a git repo, or every registered repo.
```bash
sqldash serve [TARGET] [OPTIONS]
```
| name | kind | description |
| --- | --- | --- |
| `TARGET` | argument | A dashboard .yaml file, a directory, or a git URL. Omit to serve the current directory, or, when it has no dashboards, every registered repo (see 'sqldash repo add') |
| `--port` | option | Port to listen on. Default `8400`. |
| `--host` | option | Host to bind. Default `127.0.0.1`. |
| `--branch`, `-b` | option | Branch to check out (git URLs only) |
| `--no-browser` | flag | Don't open the browser. |
| `--row-limit` | option | Max rows returned per query. Default `10000`. |
| `--all` | flag | Serve every repo registered with 'sqldash repo add'. |
| `--studio`, `--no-studio` | flag | Local coding-agent editing (enabled by default on loopback hosts) |
### sqldash setup
Write a local profile and a project source, then test the connection. Interactive with no flags. Pass --type (and the fields that type needs) to run non-interactively, passwords are always ${env:VAR} references, never literals, and they land in ~/.config/sqldash/profiles.yaml, not the repo. On a tty, missing flags are asked instead of exiting.
```bash
sqldash setup [DIRECTORY] [OPTIONS]
```
| name | kind | description |
| --- | --- | --- |
| `DIRECTORY` | argument | Repo or directory to initialize (dashboards land in .sqldash/) Default `.`. |
| `--type` | option | duckdb \| postgres \| snowflake \| bigquery \| databricks \| mysql \| url. |
| `--profile` | option | Name written to ~/.config/sqldash/profiles.yaml. |
| `--account` | option | Snowflake account locator. |
| `--host` | option | Database host. |
| `--port` | option | Database port. |
| `--database` | option | Database name; for duckdb an existing .duckdb file (relative to the project dir) or :memory:, a file that does not exist yet needs --skip-test. |
| `--schema` | option | Schema to use. |
| `--warehouse` | option | Snowflake warehouse. |
| `--role` | option | Snowflake role. |
| `--username`, `--user` | option | Database user. |
| `--auth` | option | snowflake: externalbrowser \| password \| pat \| keypair. |
| `--password-env` | option | Env var the profile's password: ${env:VAR} will name. |
| `--token-env` | option | Env var the profile's token: ${env:VAR} will name. |
| `--private-key-path` | option | Path to a Snowflake private key, for key pair auth. |
| `--url` | option | Raw SQLAlchemy URL (use ${env:VAR} for secrets) |
| `--project` | option | BigQuery project. |
| `--http-path` | option | Databricks HTTP path. |
| `--catalog` | option | Databricks catalog. |
| `--register` | flag | Register this directory with 'sqldash repo add'. |
| `--skip-test` | flag | Don't connect after writing. |
### sqldash snapshot
Render dashboards to static PNGs + an index.html, wallboards and stakeholders without warehouse credentials. Needs the 'snapshot' extra.
```bash
sqldash snapshot [TARGET] [OPTIONS]
```
| name | kind | description |
| --- | --- | --- |
| `TARGET` | argument | Project dir, dashboard .yaml, or git URL. Default `.`. |
| `--out`, `-o` | option | Output directory. Default `snapshots`. |
| `--dashboard`, `-d` | option | Only these dashboards (default: all) |
| `--theme` | option | dark \| light. Default `dark`. |
| `--width` | option | Viewport width in px (rendered at 2x) Default `1440`. |
| `--branch`, `-b` | option | Branch to check out (git URLs only) |
| `--all` | flag | Snapshot every repo registered with 'sqldash repo add'. |
### sqldash source describe
Tables and columns of a source, the raw material for metrics and queries.
```bash
sqldash source describe [TARGET] [OPTIONS]
```
| name | kind | description |
| --- | --- | --- |
| `TARGET` | argument | Project dir, dashboard .yaml, or git URL. Default `.`. |
| `--only` | option | Describe one source by its listed name. |
| `--json` | flag | Print JSON instead of a table. |
### sqldash source list
List every data source in the project (credentials redacted).
```bash
sqldash source list [TARGET] [OPTIONS]
```
| name | kind | description |
| --- | --- | --- |
| `TARGET` | argument | Project dir, dashboard .yaml, or git URL. Default `.`. |
| `--json` | flag | Print JSON instead of a table. |
### sqldash source test
Connect to each source and run SELECT 1, verifies credentials and drivers.
```bash
sqldash source test [TARGET] [OPTIONS]
```
| name | kind | description |
| --- | --- | --- |
| `TARGET` | argument | Project dir, dashboard .yaml, or git URL. Default `.`. |
| `--only` | option | Test just one source by its listed name. |
### sqldash studio add
Save an agent entrypoint. Use -- before command arguments.
```bash
sqldash studio add NAME COMMAND [OPTIONS]
```
| name | kind | description |
| --- | --- | --- |
| `NAME` | argument, required | Display name, e.g. Custom agent. |
| `COMMAND` | argument, required | Command and arguments; include {prompt}. |
| `--shell` | option | Absolute bash/zsh path for aliases/functions. |
| `--env` | option | Local environment override KEY=VALUE. |
### sqldash studio check
Check that an entrypoint resolves without starting the coding agent.
```bash
sqldash studio check NAME
```
| name | kind | description |
| --- | --- | --- |
| `NAME` | argument, required | Registry name. Defaults to the repo's basename. |
### sqldash studio list
List discovered and saved entrypoint names and commands (never environment values).
```bash
sqldash studio list
```
---
# FAQ
## How is this different from Metabase?
Metabase is a server with its own database of dashboards, users, and permissions,
and you build everything in its GUI. sqldash has no server to deploy or operate and
no accounts to manage. A dashboard is a file in your repo, the pull request is the
review, git is the history, and your warehouse credentials are the permission model.
## How is this different from Evidence?
Evidence pages are markdown with SQL, and Node builds them into a static site whose
data is extracted at build time, so viewers see whatever the last build fetched.
sqldash has no build step. A dashboard is one YAML file, every query
runs live against your warehouse with the viewer's own credentials, and the same
metrics are served to agents over MCP.
## How is this different from Rill?
Rill is also BI as code with YAML metrics views, but it is built around its own OLAP
engines and its git workflow lives in Rill Cloud. sqldash queries the warehouse you
already have, and git is built into the tool. You can serve a git URL, register several
repos as one workspace, edit in the browser, and commit the diff. No cloud is required,
and the semantic layer is served to agents over MCP from your laptop.
## How is this different from dbt Charts?
dbt Charts, from dbt Labs, also keeps dashboards as YAML in git and runs SQL against
your own warehouse. The biggest difference is where a number is defined. A dbt Charts
board carries its own SQL, so every board that shows revenue writes it again. A sqldash
tile can name a metric defined once in `metrics.yaml`, and that same definition answers
the CLI and agents over MCP. The browser edits the YAML for you, AI Studio hands requests
to your own coding agent, and sqldash serves any repo without a dbt project. dbt Charts
has more chart types, static PDF and SVG output, a VS Code extension, and a closer fit
with dbt projects.
## How is this different from Streamlit?
Streamlit is a framework for writing apps in Python. sqldash is declarative. A dashboard
is data rather than code, so there is nothing to program, and an agent can write one as
easily as a person.
## Can I bring the semantic layer I already have?
Yes. Import LookML or Snowflake semantic views into `metrics.yaml`, export back to
either, or generate a Cortex Agent and its scoped semantic view from an agent in your
repo. See [LookML & Cortex](/docs/lookml-cortex/).
## Do I have to run a server?
No server to deploy. `sqldash serve` runs on your laptop and queries your databases
with your own credentials. For people who have no warehouse access,
`sqldash snapshot` renders static pages they can open anywhere.
## Where do credentials go?
Use `${env:VAR}` references to read credentials from your environment, or a per-user
profile file. This keeps credential values out of the dashboard YAML you commit, and
everyone connects to the warehouse as themselves. See [Setup](/docs/setup/).
## Does it work with my warehouse?
Snowflake, BigQuery, Databricks, Redshift, Athena, Postgres, MySQL, SQL Server,
Trino, ClickHouse, SQLite, and DuckDB have flat config. Anything else SQLAlchemy can
reach works with a raw connection URL. See [Sources](/docs/sources/).
## Does my data leave my machine?
Queries run from your machine against your warehouse, and results are shown in your
browser. sqldash has no service or account behind it and collects no analytics,
telemetry, or crash reports. It never checks for updates or contacts a server of its
own, and it connects only to the warehouses and git remotes you configure. The pages
`sqldash serve` shows load everything from the local server, and their content security
policy blocks every other origin.
sqldash does not include or call an AI model. If you use [AI Studio](/docs/studio/),
the coding agent you choose receives the request context you review before sending,
without query results. When you connect a coding agent over [MCP](/docs/mcp/), the
results it asks for go back to that agent, and its model provider sees them the way it
sees anything else in the conversation.
The [privacy policy](https://github.com/dylan-murray/sqldash/blob/main/PRIVACY.md)
lists everything sqldash reads, what it connects to, and every file it keeps on your
machine.
## How do I report a security problem?
Please report it privately rather than in a public issue. On the repository's
**Security** tab, click
[Report a vulnerability](https://github.com/dylan-murray/sqldash/security/advisories/new),
and the fix and advisory get worked out in that private thread. The
[security policy](https://github.com/dylan-murray/sqldash/blob/main/SECURITY.md) says
what to include, what counts, and which versions get fixes.
## Can several people share dashboards?
Share them the way you share code. Commit the YAML and review changes in pull
requests. Everyone serves the repo locally with their own credentials, or serves the
git URL directly. See [Workspaces](/docs/workspaces/).