BI for the agentic era.

Business users answer their own questions from dashboards and metrics your data team defines as YAML and reviews in pull requests. It runs against your own warehouse, and agents query the same definitions over MCP.

We’ll email you once, when Cloud opens.

agent · sqldash mcp --all
> how did revenue do by region last month?
query_metric name payments/revenue · dimensions [region] start -30d · compare previous_period
us$1,284,900+14%
eu$612,4000%
apac$338,150+9%
US up 14%, EU flat, APAC up 9%.
> which channel drove signups this week?
query_metric name growth/signups · dimensions [channel] start -7d · compare previous_period
organic4,182+22%
paid1,905-3%
referral774+4%
Organic carried it, up 22% on last week.
> is our error rate up today?
query_metric name ops/error_rate · grain hour start today
13:000.42%
14:001.24%
15:000.33%
It spiked at 14:00 and has been normal since.
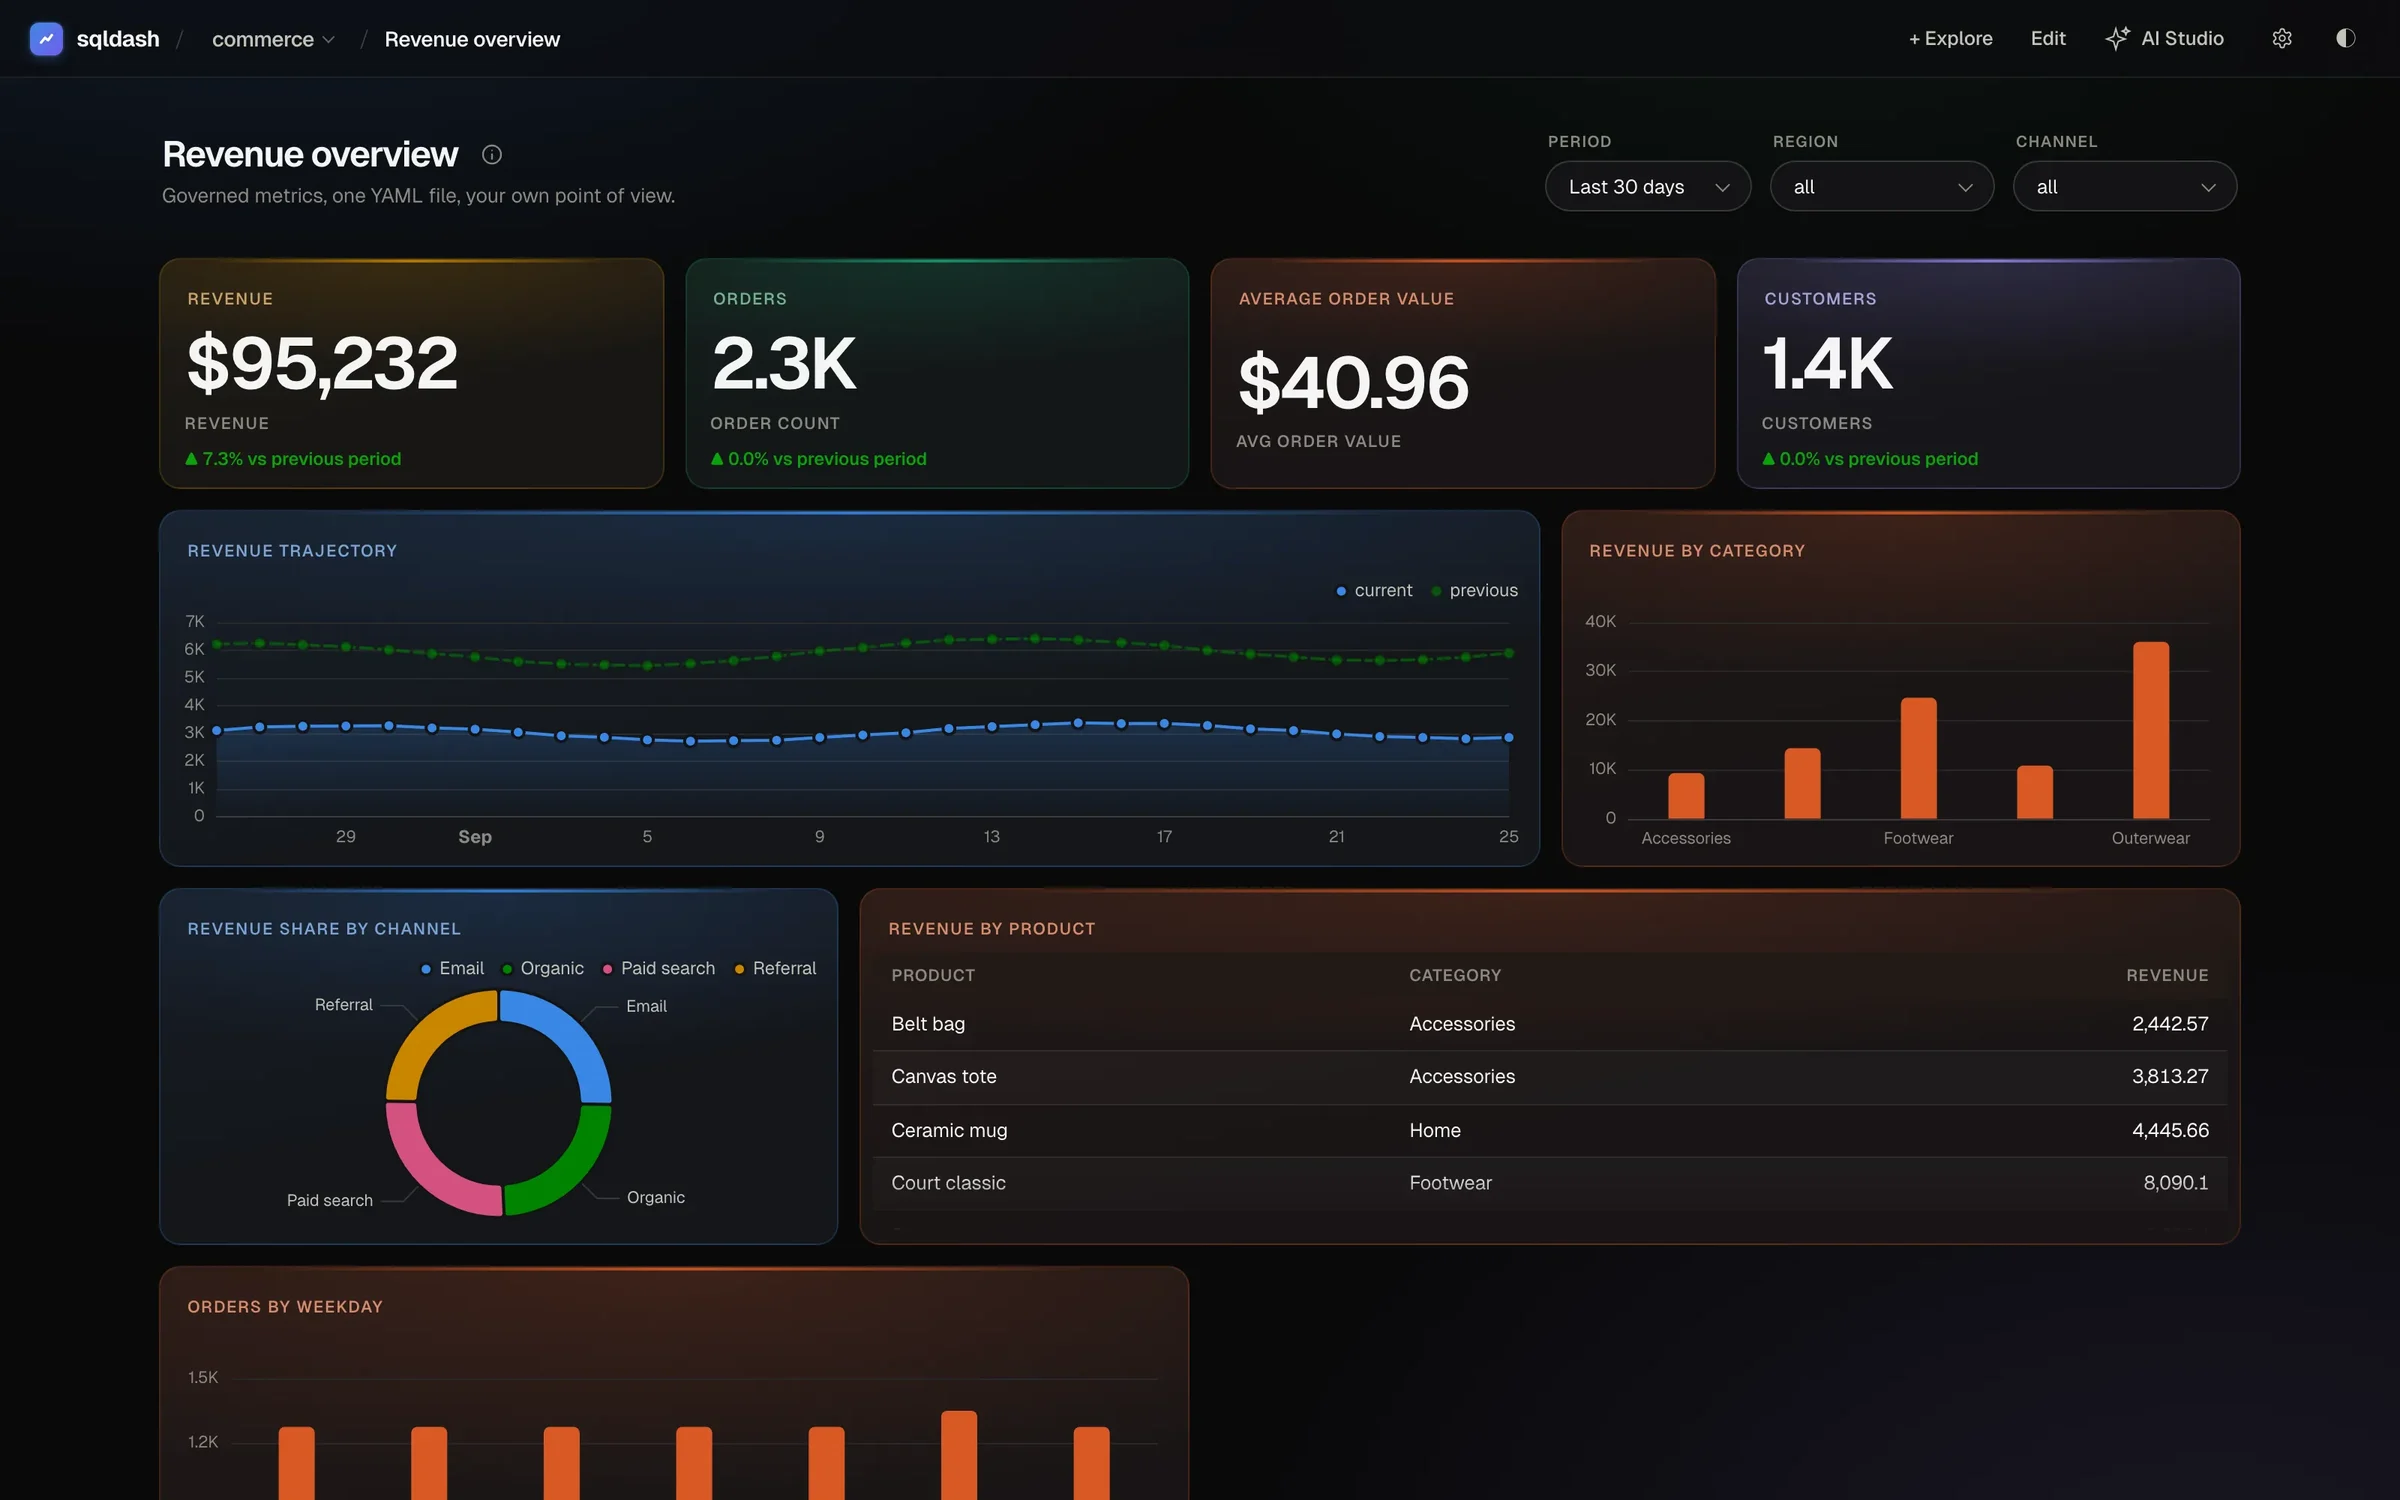
The Revenue overview dashboard in sqldash: revenue, orders, average order value and customer tiles, a revenue trajectory, revenue by category and channel, a product table, and an orders-by-weekday chart
# commerce/revenue.yaml
title: Revenue overview

filters:
  - {name: dates, type: daterange}
  - {name: region, type: select}
  - {name: channel, type: select}

tiles:
  - metric: revenue
    compare: previous_period
  # added from + Explore
  - title: Orders by weekday
    query: orders_by_weekday
    chart: bar
AI Studio

Point. Ask. Make it yours.

Pin a request onto the tile it belongs to and send it to your coding agent. Claude Code, Codex, or your own headless entrypoint, running locally as you. The dashboard updates while you keep chatting.

Governance

Defined as code.

Dashboards, metrics, agents, even the theme. An agent can draft any of them and none of it can quietly change what revenue means, because the edit arrives as a pull request. sqldash lint runs in CI and your coworker approves it.

Your warehouse

Your credentials stay where they are.

Passwords and tokens come from environment variables, or from a named profile each teammate keeps on their own machine, the way AWS profiles work. The YAML you commit holds a reference, never a secret.

One flat mapping per source, with the same keys for every engine. Snowflake, BigQuery, Databricks, Redshift, Athena, Postgres, MySQL, SQL Server, Trino, ClickHouse, DuckDB, and SQLite all configure the same way, and anything else connects with a URL.

source:
  type: snowflake
  account: acme-prod
  warehouse: WH
  database: ANALYTICS
  schema: PUBLIC
  username: ${env:SNOWFLAKE_USER}
  authentication: externalbrowser
source:
  type: bigquery
  project: acme-analytics
  schema: warehouse
source:
  type: databricks
  host: dbc-1234.cloud.databricks.com
  http_path: /sql/1.0/warehouses/abc123
  catalog: main
  schema: analytics
  token: ${env:DATABRICKS_TOKEN}
source:
  type: postgres
  host: db.internal
  port: 5432
  database: analytics
  schema: public
  username: ${env:PGUSER}
  password: ${env:PGPASSWORD}
# every .csv and .parquet next to the dashboard,
# as a view named after the file. Nothing to connect.
source: {type: duckdb, attach_files: true}
# whatever SQLAlchemy can reach, Oracle included
source:
  url: oracle+oracledb://analyst:${env:ORACLE_PASSWORD}@db.internal:1521/?service_name=ANALYTICS

Nothing to deploy

sqldash serve runs on your laptop. No cluster to run, no build step, and no account to create.

Everyone connects as themselves

Credentials come from ${env:VAR} or a per-user profile file, so your warehouse stays the permission model.

Share without giving access

sqldash snapshot renders static pages anyone can open, with no credentials in the serving path.

All source options → Connect a warehouse → Snapshots →

Agents as code

Your metrics. Your agent. In your repo.

An agent's instructions, data tools, and evals live in agents.yaml, next to the metrics it reads. Register the repos it should see and sqldash mcp serves those and nothing else.

paymentsbilling service
├─ src/ ├─ .sqldash/ │ ├─ metrics.yaml │ └─ agents.yaml └─ README.md
$ sqldash repo add …/payments.git
growthmarketing analytics
├─ dbt/ ├─ .sqldash/ │ ├─ metrics.yaml │ └─ agents.yaml └─ README.md
$ sqldash repo add …/growth.git
opsplatform & infra
├─ terraform/ ├─ .sqldash/ │ ├─ metrics.yaml │ └─ agents.yaml └─ README.md
$ sqldash repo add …/ops.git
sqldash mcp --all
metrics + agent prompts
payments/finance_analyst growth/signups ops/error_rate
Any MCP client
Claude Codeclaude mcp add
Codexcodex mcp add
Cursor.cursor/mcp.json
Claude Desktopclaude_desktop_config.json
your own agentMCP SDK, stdio
coding agents and chat apps
$ claude mcp add sqldash -- sqldash mcp --all

Agents, tools, and evals →MCP reference →

No lock-in

Bring your existing BI.

Import the LookML and Snowflake semantic views you already have. Export your sqldash metrics back to LookML, a semantic view, or a Cortex Agent at any time, so trying sqldash never locks you in.

Your BI
LookML views
Snowflake semantic view
~/acme/analytics
$ sqldash import lookml views/
Back out
LookML
Snowflake semantic view
Cortex Agent

LookML & Cortex →

Get started

Two minutes to your first dashboard.

Start with the DuckDB demo, no credentials needed. When you're ready, sqldash setup connects your warehouse using a local credential profile.

terminal
$ uv tool install sqldash
Installed 1 executable: sqldash
$ sqldash init --demo
created .sqldash/demo.yaml
created .sqldash/metrics.yaml
created .sqldash/agents.yaml
created .sqldash/data/orders.csv
$ sqldash serve
sqldash serving ~/shop at http://127.0.0.1:8400

Prefer not to install it? uvx sqldash init --demo and uvx sqldash serve run it from uv’s cache, and uv fetches Python 3.11 or newer if you need it.

To let your coding agent in, add it once. In Codex run codex mcp add sqldash -- uvx sqldash mcp ., in Claude Code claude mcp add sqldash -- uvx sqldash mcp ., and see MCP for other clients.

Send us a note

×

Questions, feedback, or a warehouse you want supported. It goes straight to our inbox.