# Explore
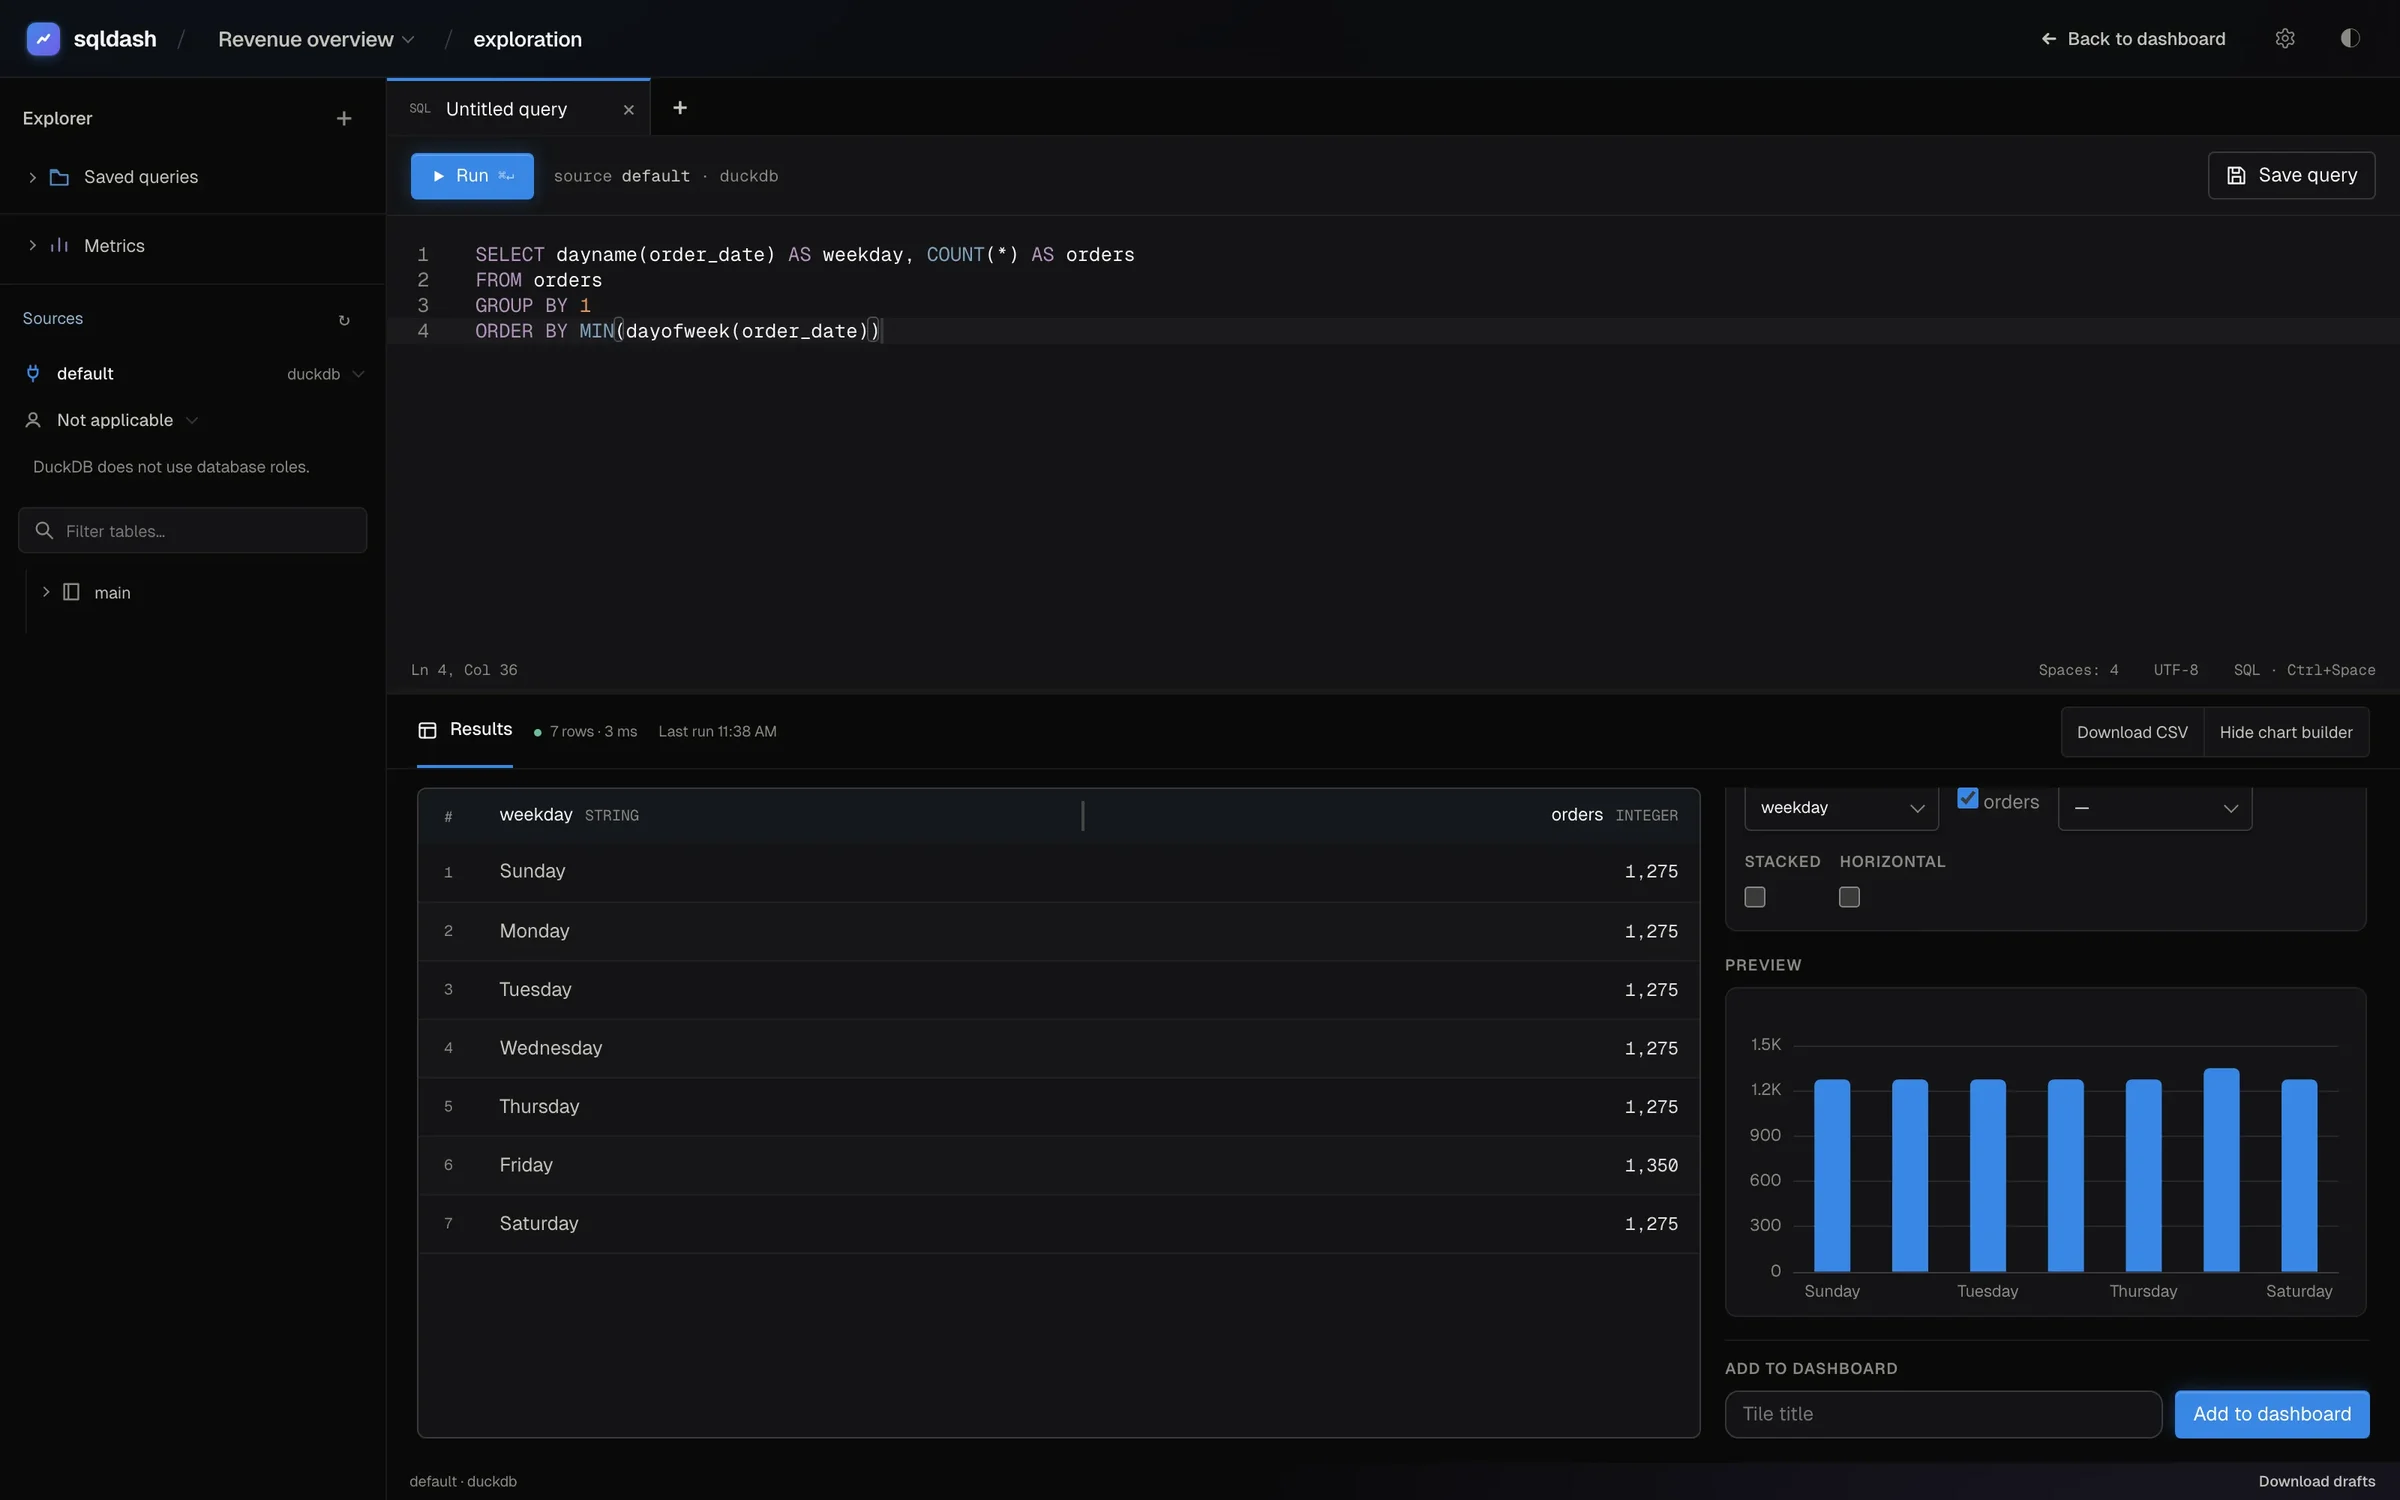
**+ Explore** opens the query workspace, where you write SQL against a dashboard's
connections, look at the results, chart them, and add the chart to the dashboard as a
tile. It is how new tiles get made in the browser. The pencil on an existing tile still
opens that one tile for direct editing.
On a dashboard, **+ Explore** sits in the top bar next to **Edit**. On the dashboard
list it opens the workspace for the only dashboard, or asks which one to use when there
are several, because a dashboard supplies the connections, the filter definitions, and
the destination for new tiles.
An orders-by-weekday query, charted as bars and ready to add to the dashboard
### Write and run a query
The workspace opens with a query tab. Type SQL and press **Run**, or ⌘⏎ (Ctrl⏎ on Linux).
```sql
SELECT region, ROUND(SUM(amount), 2) AS revenue
FROM orders
GROUP BY region
ORDER BY revenue DESC
```
The sidebar's **Sources** section lists the tables and columns of the selected
connection. Filter it by name, and click a table or column to insert it at the cursor.
**Metrics** lists the project's governed metrics, and picking one opens a **Metric**
tab where you choose its dimensions and grain, so a tile built from it stays tied to
the definition rather than to copied SQL.
A tab can also be a **Text** tab for a markdown tile, and **Download CSV** saves the
result of the current run.
### Chart it and add it to the dashboard
Beside the results, the chart builder picks a chart type and its columns. Name the tile
and click **Add to dashboard**. The tile lands in the dashboard's YAML with the query and
chart settings, as an ordinary diff.
The tab stays open after you add it. Choose another chart type and click **Add another
tile** to put a second view of the same result on the dashboard. Both tiles reference
one SQL definition, each with its own chart settings.
### Save it for later
**Save query** keeps the SQL in the project's query library without creating a tile.
The library appears under **Saved queries** in the sidebar, grouped by connection, and
any dashboard in the same project can open it, as long as the connection and the filter
definitions the query needs are compatible.
## Where things are kept
| what | where |
| --- | --- |
| Open tabs and drafts | Your browser's local storage, scoped to the project and dashboard. Up to twenty tabs. |
| Saved queries | `.sqldash/queries/.yaml` in the project, with readable SQL, a title, the source reference, and the filter definitions it needs. |
| Tiles you add | The dashboard's own YAML, under `queries:` and the tile's `query:`. |
Drafts survive a reload, including their SQL, source, and chart settings, but results
never run on their own after a reload. **Download drafts** saves them as a file when the
browser cannot keep them. Closing a tab that is still running cancels its query.
Adding a saved query to a dashboard copies its SQL and source into that dashboard
rather than linking to the library file. Renaming or deleting a library query leaves
those copies alone. When you edit SQL that several tiles share, the workspace lists the
tiles that use it and offers a copy for the current tile, so an edit never repoints a
tile you did not mean to change.
## Pick the role, database, and warehouse
The **Sources** section starts with a connection picker, which lists the dashboard's
connections and the project's. Under it, a **Role** picker shows the roles the
connection can switch to, on the engines that have session roles, which are Snowflake,
Postgres, MySQL, MariaDB, Trino, and ClickHouse over HTTP. SQL Server and Redshift show the roles that
apply without offering a switch, and DuckDB, SQLite, BigQuery, Athena, and Databricks
say what governs access instead.
On Snowflake the section also has **Database** and **Warehouse** pickers, and the role
picker is labelled **Primary role**. What you pick applies to the current tab only. See
[Sources](/docs/sources/#pick-a-role-database-and-warehouse) for how each one behaves,
including what happens when a role cannot use the connection's warehouse or database.
A tile added from a tab with a picked role, database, or warehouse keeps that choice.
The connection is copied into the dashboard's `source:` map under a name that says what
was picked, with the role, database, and warehouse written into it, so the tile runs the
same way for everyone who serves the dashboard.
## Who can run what
Anyone who can load a served dashboard can type SQL here, with the credentials of the
person running `sqldash serve`. On a warehouse, that credential's grants are the
boundary. A DuckDB source has no credential of its own, so sqldash confines it to the
project's own folders, as described in [Sources](/docs/sources/#duckdb-reads-only-the-project).